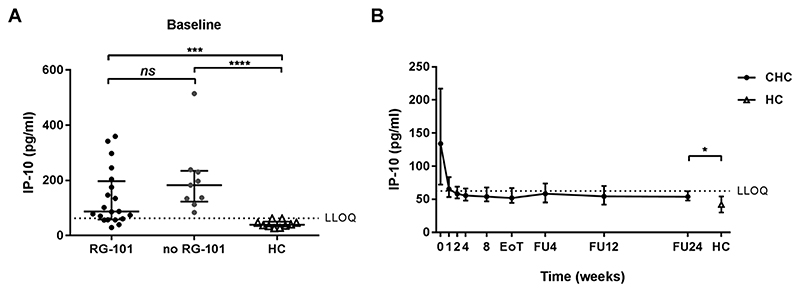
Fig. 2. IP-10 levels of patients with and without previous RG-101 dosing.
(2A) Baseline IP-10 levels in patients with (black dots) and without (grey dots) previous RG-101 dosing and healthy controls (HC, white triangles), median and interquartile range are shown. Mann-Whitney U test was used to compare study groups. (1B) IP-10 levels in CHC patient throughout the study period up to follow-up week 24 (FU24), median and interquartile range are shown. Mann-Whitney U test was used to compare study groups. LLOQ, lower limit of quantification. *p < 0,05; ***p < 0.001; ****p < 0,0001.

