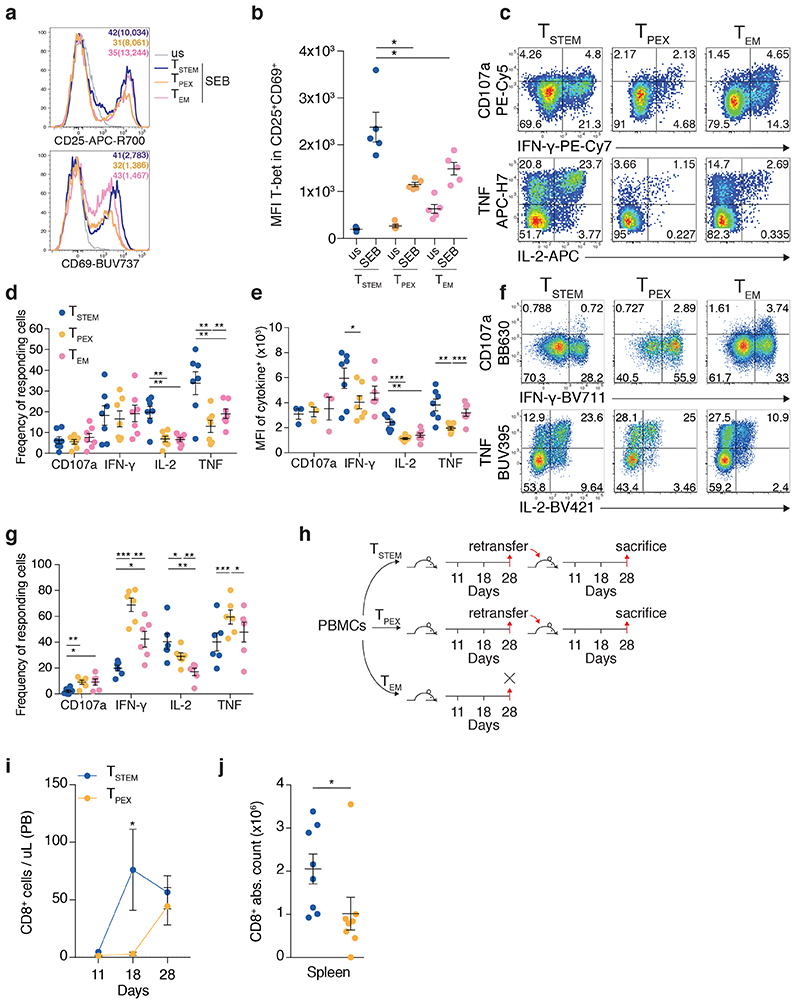
Fig. 3. Functional properties of TSTEM and TPEX cells.
a, Representative flow cytometric analysis of FACS-purified TSTEM, TPEX, and TEM cells showing the expression of CD25 and CD69 before (us, unstimulated) and after stimulation with SEB for 24 h. Similar data were obtained from other donors (n = 4). Numbers colored to match each subset indicate percent marker+ cells with the corresponding median fluorescence intensity (MFI) in brackets. b, Dot plot showing the expression of T-bet among CD25+ CD69+ TSTEM, TPEX, and TEM cells before (us) and after stimulation as in a. Data are shown in terms of MFI. Each dot represents one donor (n = 5 from two independent experiments). Bars indicate mean ± SEM. *P < 0.05 (two-tailed paired t-test). c, Representative flow cytometric analysis showing the expression of CD107a, IFN-γ, IL-2, and TNF among TSTEM, TPEX, and TEM cells stimulated with anti-CD3 plus CD28 for 12 h. Numbers indicate percentages in the drawn gates. d, Dot plot summarizing the data obtained as in c. Each dot represents one donor (n = 7 from four independent experiments). Bars indicate mean ± SEM. **P < 0.01 (two-tailed paired t-test). e, Dot plot showing the function+ populations identified in d in terms of MFI. Each dot represents one donor (n = 3 from four independent experiments for CD107a, n = 7 from four independent experiments for IFN-γ, IL-2, and TNF). Bars indicate mean ± SEM. *P < 0.05, **P < 0.01, ***P < 0.001 (two-tailed paired t-test). f, Representative flow cytometric analysis showing the expression of CD107a, IFN-γ, IL-2, and TNF among TSTEM, TPEX, and TEM cells after stimulation of magnetically-enriched CD8+ T cells with PMA and ionomycin for 3 h. Numbers indicate percentages in the drawn gates. Subsets were gated as CCR7+ GZMK− (TSTEM), CCR7+ GZMK+ (TPEX), or CCR7− CD45RO+ CD95+ (TEM). g, Dot plot summarizing the data obtained as in f. Each dot represents one donor (n = 6 from three independent experiments). Bars indicate mean ± SEM. *P < 0.05; **P < 0.01; ***P < 0.001 (two-tailed paired t-test). h, Schematic layout of the serial transfer experiments. i, Line chart showing the absolute numbers of CD8+ T cells in PB on days 11, 18, and 28 after transfer of TSTEM or TPEX cells into secondary NSG recipients. Data were pooled from two independent experiments (total n = 8 mice). Bars indicate mean ± SEM. *P = 0.0117 (two-way ANOVA). j, Dot plot showing the absolute numbers of CD8+ T cells in spleen on day 28 after transfer of TSTEM or TPEX cells into secondary NSG recipients. Each dot represents one mouse (n = 8 from two independent experiments). Bars indicate mean ± SEM. *P = 0.0148 (two-tailed Mann-Whitney U test).

