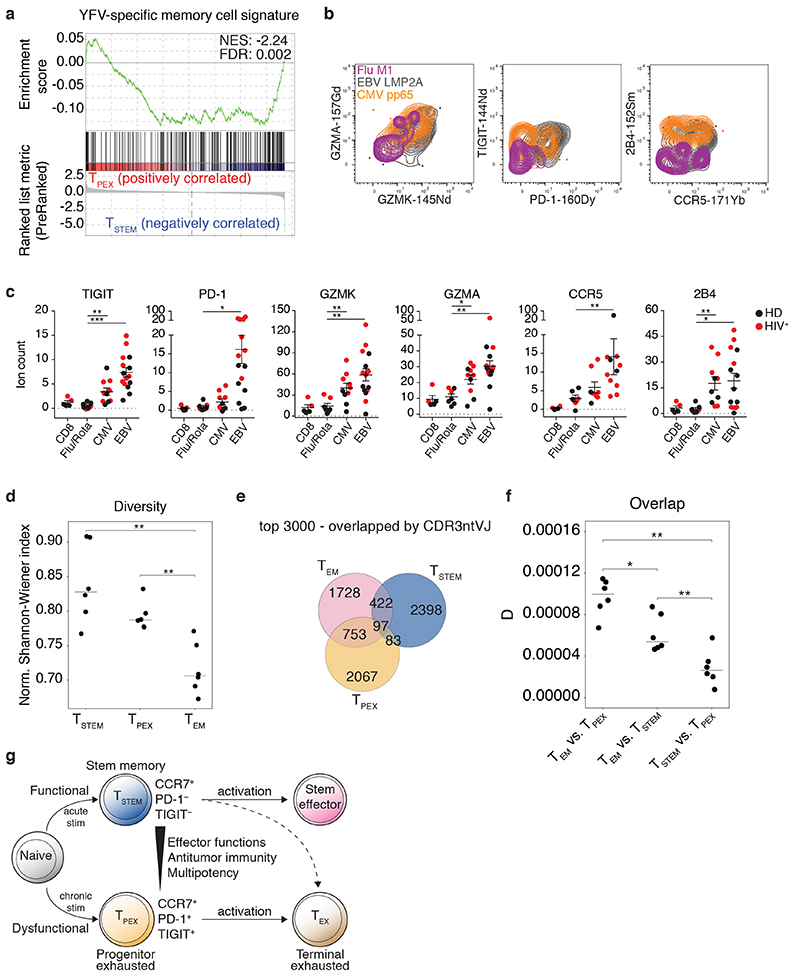
Fig. 5. Antigen specificity and clonal identity of TSTEM and TPEX cells.
a, GSEA of the YFV-specific CD8+ memory T cell signature45 in TSTEM versus TPEX cells. b, Representative CyTOF analysis showing the expression of GZMK, GZMA, PD-1, TIGIT, CCR5, and 2B4 among CCR7+ virus-specific CD8+ T cell populations from healthy (n = 3) and HIV+ donors (n = 2). c, Dot plots summarizing the data obtained as in b. Epitopes derived from influenza virus (n = 6) and rotavirus (n = 1) were pooled for simplicity. Comparative data are shown for the corresponding total CD8+ T cell populations. Each dot represents one specificity in one donor (n = 3 healthy donors, n = 2 HIV+ donors). Bars indicate mean ± SEM. *P < 0.05, **P < 0.01, ***P < 0.001 (two-tailed Mann-Whitney U test for CCR5 comparisons, two-tailed unpaired t-test for all other marker comparisons). HD, healthy donor. d, Dot plot showing the normalized Shannon-Wiener index for TCRβ repertoires obtained from the TSTEM, TPEX, and TEM subsets. Each dot represents one donor (n = 6). Bars indicate median values. **P < 0.01 (two-tailed paired t-test with Bonferroni correction). e, Venn diagram showing the numbers of shared and unique clonotypes among TSTEM, TPEX, and TEM cells from a representative donor. Similar data were obtained from other donors (n = 5). Analysis was restricted to the top 3,000 clonotypes. f, Dot plot summarizing the pairwise comparisons among subsets illustrated in e. D metric in VDJtools. Each dot represents one donor (n = 6). Bars indicate median values. *P < 0.05, **P < 0.01 (two-tailed paired t-test with Bonferroni correction). g, Proposed model showing the origins and differentiation trajectories of TSTEM and TPEX cells.

