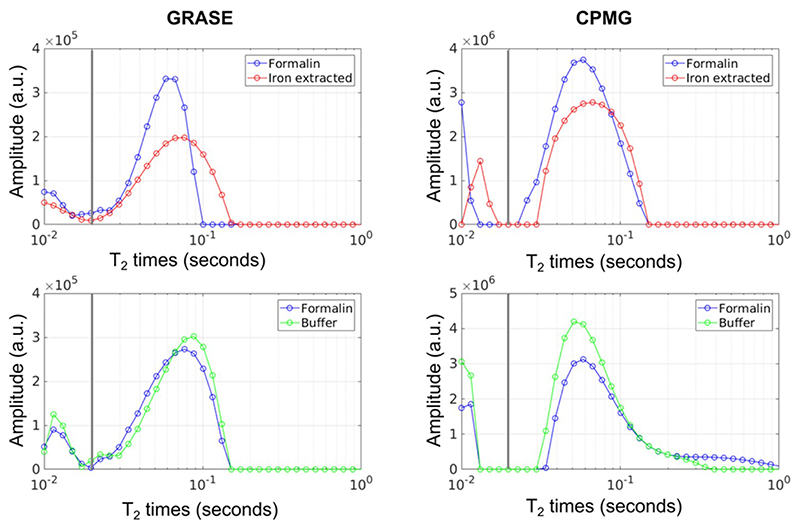
Fig. 4.
Representative white matter T2 distributions of a brain slice stored in formalin compared to a brain slice where chemical iron extracted was performed (top row). The bottom row shows representative T2 distributions of a brain slice stored in formalin compared to a brain slice treated with buffer solution. All brain slices used for this figure were from the same brain. The T2 distributions were assessed using the GRASE and CPMG sequence. The vertical solid gray line represents the cut-off between the short and long T2 components.

