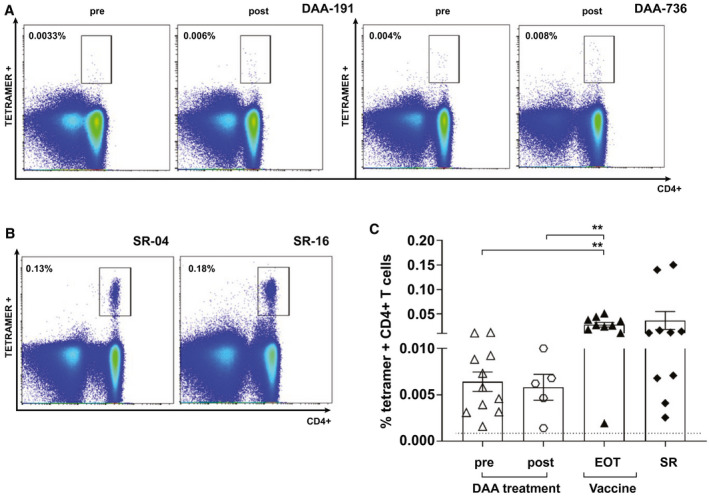
Fig. 2.

Assessment of ex vivo tetramer+ CD4+ T cells pre‐DAA and post‐DAA treatment, following vaccination and in SR volunteers. (A,B) FACS example plot of staining with tetramers 14 HCV‐NS4B1806‐1818, 24 HCV‐NS31535‐1551 or pool of tetramers 17 HCV‐NS31582‐1597, tetramer 18 HCV‐NS31411‐1425, and tetramer 19 HCV‐NS31535‐1551 in 2 DAA patients pretherapy and posttherapy and in 2 SRs. Gating is on live CD3+ cells. Values indicate the percentage of CD4+ T cells binding the tetramer. (C) Percentage of tetramer+ CD4+ cells after ex vivo staining at the end of study of vaccinated healthy volunteers, DAA pretherapy and posttherapy, and in SR persons. Error bars represent the SEM. Only statistical differences are shown.
