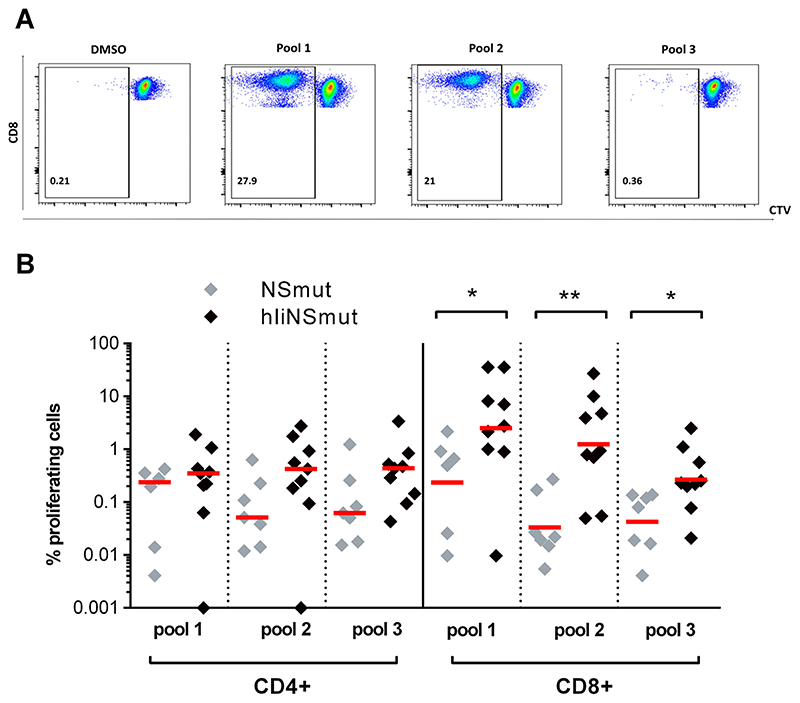
Figure 5. Sustained and enhanced proliferative T cell capacity after ChAd3/MVA-hIiNS vaccination regimen.
(A) Example FACS plots of proliferated CD8+ T cells after stimulation with pool 1 (first highest pool at boost), pool 2 (second highest pool at boost) and pool 3 (lowest at EOS but positive at boost) using cell trace violet reagent in T cell proliferation assays.
(B) Percentage of proliferated CD4+ and CD8+ T cells of subjects vaccinated with ChAd3/MVA-NSmut (grey, n=7) and ChAd3/MVA-hIiNSmut (black, n=9) at EOS after stimulation with peptide pools (Two-tailed Mann-Whitney test for CD8+ pool 1, pool 2 and pool 3). Only statistically significant differences are shown. Bars represent median. *P ≤ 0.05; **P ≤ 0.01;

