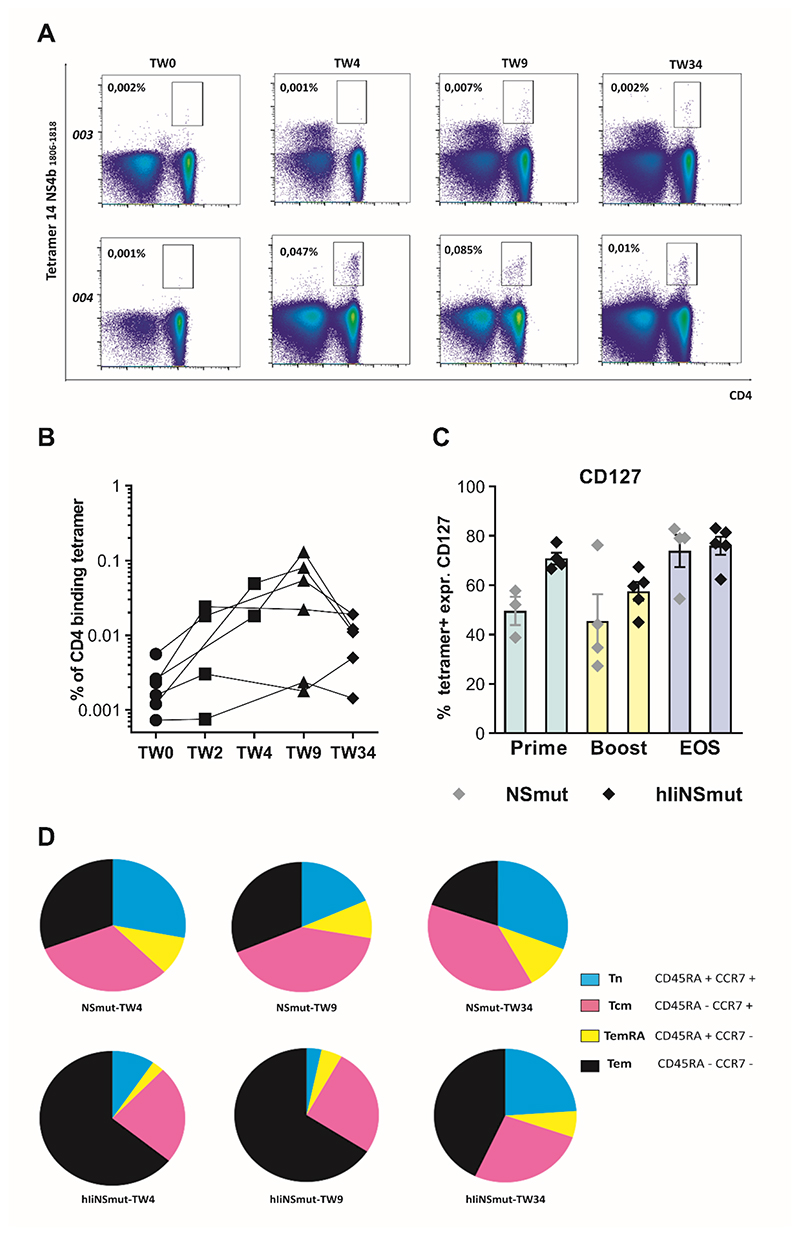
Figure 7. Phenotyping of tetramer+ CD4+ HCV-specific vaccine-induced T cells.
(A) Example FACS plots of ex vivo staining with MHC class II tetramer DRB01*01 NS31806-1818 in volunteers 003 (vaccinated with ChAd3/MVA-NSmut) and 004 (vaccinated with ChAd3/MVA-hIiNSmut) over the study time course. (B) The percentage of specific CD4+ T cells stained with a single tetramer (for PEA03-01113,17, 18, 22) or a combination of them (for PEA03-01119, 26) is shown over time for individual volunteer receiving ChAd3-hIiNSmut/MVA-hIiNSmut vaccination (n=6). (C) The percentage of the tetramer+ cells expressing CD127 from volunteers vaccinated with ChAd3/MVA-NSmut (grey symbols) or ChAd3/MVA-hIiNSmut (black symbols) at peak post-prime (green bars; grey n=3, black n=4), at peak post-boost (yellow bars; grey n=4, black n=5) and EOS (light blue bars; grey n=4, black n=5). Only statistically significant differences are shown. (D) Pie charts display the proportion of tetramer+ CD4 Tn, TemRA, Tcm, and Tem subsets over the course of the study for the two vaccination regimens, as specified by staining for CD45RA and CCR7 at peak post-prime (NSmut, n=3; hIiNSmut n=4) at peak post-boost and EOS (NSmut, n=4; hIiNSmut n=5). Pie base, Median.

