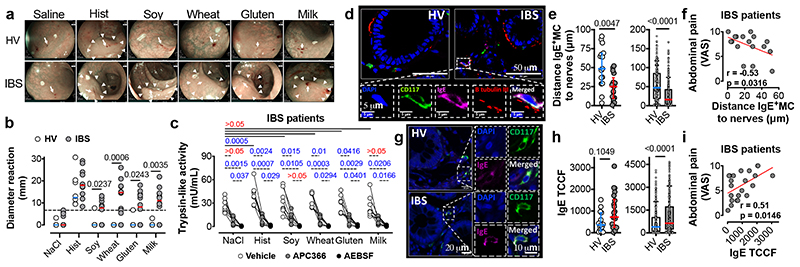
Fig. 4. Intramucosal injection of food antigens induces an immediate mucosal response in IBS patients.
a, representative images (arrows, antigen injection site; arrow-heads, reaction area) and (b) diameter reaction to food antigen injection in HV and IBS patients (n = 8 and 12, respectively) (dotted line represents the threshold for positive reactions). c, trypsin-like activity in rectal biopsies supernatants after antigen injection in IBS patients (n = 8). d, micrographs used to measure (e) IgE+ MC-nerve fibers distance in HV (n = 15 subjects [left], 206 cells [right]) and IBS patients (n = 17 subjects [left], 296 cells [right]). f, correlation between the IgE+ MC-nerve fibers distance and abdominal pain severity in IBS patients (n = 17). g, micrographs used to quantify (h) IgE intensity (TCCF) in MC in mucosal rectal biopsies from HV (n = 15 subjects [left], 261 cells [right]) and IBS patients (n = 22 subjects [left], 315 cells [right]). i, correlation between the IgE TCCF and abdominal pain severity in IBS patients (n = 22). Two-tailed Mann-Whitney test in b, e and h; two-way ANOVA (Sidak’s multiple-comparisons test) in c; two-tailed Spearman’s and Pearson’s correlation in f and i, respectively. Data represented as individual dots and median in b and median ± IQR in e and h left panels. e and h right panes show Box-and-whiskers (center line, median; box, 25th-75th percentiles; whiskers, 10th-90th percentiles).

