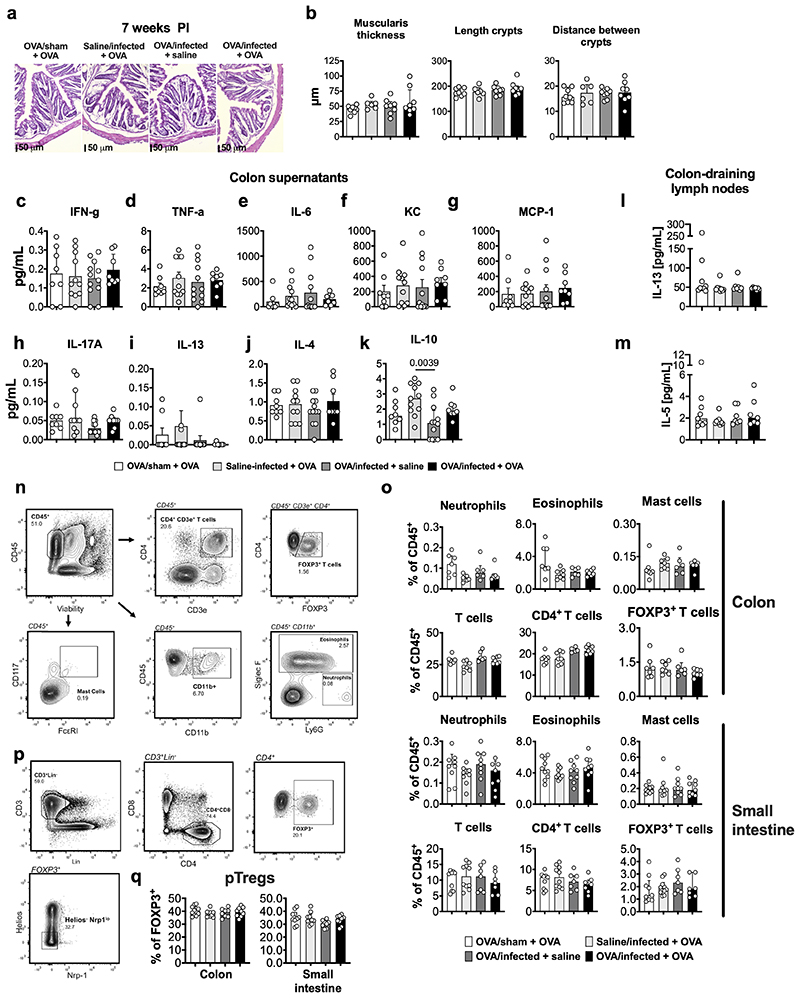
Extended Data Fig. 3. Analysis of ‘low grade’ inflammation in colonic samples of post-infectious mice.
a, Representative H&E-stained colonic sections from OVA/sham + OVA, OVA/infected + saline, saline/infected + OVA and OVA/infected + OVA at 7 weeks post-infection. b, thickness of the colonic muscularis (left), length of the crypts (middle) and distance between crypts (right), measured in OVA/sham + OVA, saline/infected + OVA (n = 6), OVA/infected + saline and OVA/infected + OVA mice (n = 8, 6, 8 and 8, respectively) at 7 weeks post-infection. c-k, concentration of (c) IFN-γ, (d) TNF-α, (e) IL-6, (f) KC (murine IL-8 homologue), (g) MCP-1, (h) IL-17A, (i) IL-13, (j) IL-4 and (k) IL-10 assessed in colonic supernatant and (l) IL-13 and (m) IL-5 in colon-draining lymph nodes (coMLN) of OVA/sham + OVA, saline/infected + OVA, OVA/infected + saline and OVA/infected + OVA mice (n = 8, 11, 12 and 8, respectively, for c-k; n = 7, 7, 9 and 9, respectively for l and m). n-q, immune cell quantification along the intestinal tract: (n and p) gating strategy; (o) quantification of population of CD11b+Ly6G+SiglecF- neutrophils, CD11b+SiglecF+ eosinophils, CD117+FcRεI+ mast cells, CD3+ T cells, CD3+CD4+ T cells, CD3+CD4+Foxp3+ T cells and (q) Helios- Nrp1loFOXP3+ pTregs in the colon and small intestine in OVA/sham + OVA, saline/infected + OVA, OVA/infected + saline and OVA/infected + OVA mice (n = 7, 6, 7 and 7, respectively, for o (colon); 9, 8, 9 and 10, respectively, for o (small intestine); 9, 9, 8 and 10, respectively, for q (Helios-Nrp1loFOXP3+ pTregs in colon); 9, 9, 8 and 10, respectively, for q (Helios-Nrp1loFOXP3+ pTregs in small intestine);. One-way ANOVA (Sidak’s multiple-comparisons test) in b-m, o and q. Data shown median ± IQR in b-m, o and q.

