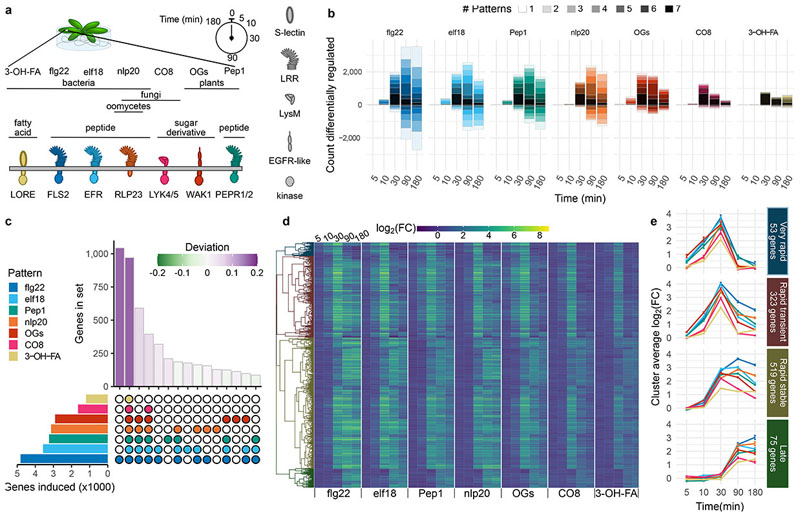
Fig. 1. Rapid pattern-triggered transcriptional responses are largely common, with characteristic kinetics.
a, Arabidopsis seedlings were treated with a panel of patterns, and tissue harvested for RNA extraction at indicated times. b, Genes up- or down-regulated (|log2(FC)|>1 and padj c, UpSet diagram showing the size of gene sets induced by each pattern (left, single gene list from all times combined) and the top 15 intersections (bottom right) by size (top right). Bars for set sizes are colored by deviation from size predicted by random mixing. d, Heat map of expression of the genes commonly induced by all tested patterns. Genes are hierarchically clustered according to their behavior across all pattern/time combinations, and cut into four clusters. e, Visualization of average log2(FC) patterns of the four clusters identified in d, showing different approximate patterns of expression (time points spaced evenly to visualize early times). Error bars represent standard error of the mean.

