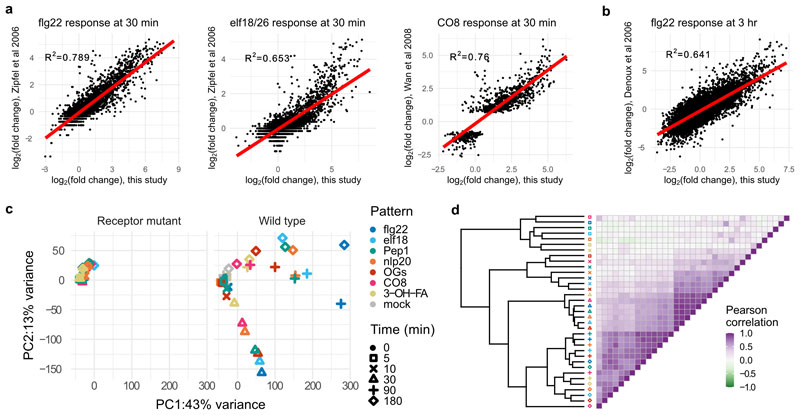
Extended Data Fig. 1. Quality control and exploratory analysis of RNA-seq data.
Expression changes in this study at a, 30 min and b, 3 h are plotted against previously published results for flg22, elf18/26, and chitooctaose (CO8). Linear correlation shown in red, with R2 (linear regression) shown on each plot. c, PCA analysis of log2(FC) of differentially expressed genes, showing (left) minimal changes in receptor-mutant treated plants, mostly corresponding with later time points, and rays of response (right) corresponding with plants at 30, 90, or 180 min post-treatment. d, Pearson correlation heatmap of DESeq2-calculated log2(FC) showing clustering largely by time point, with the strongest correlations at 30 min.

