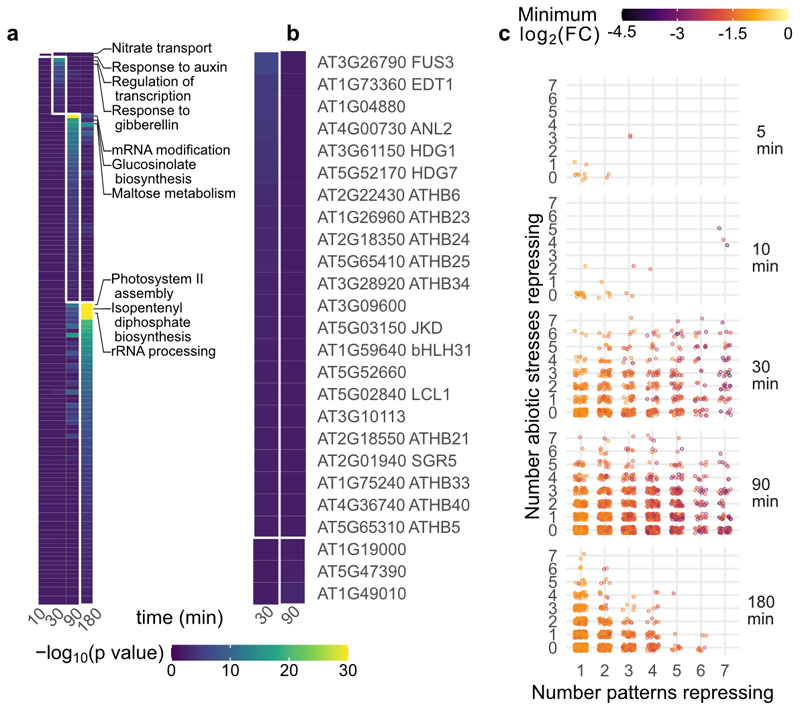
Extended Data Fig. 5. Pattern-triggered transcriptional repression acts in time-resolved waves.
a, GO term and b, cis-element enrichment analysis of repressed genes, categorized according to the time point at which they first passed significance threshold, regardless of which pattern caused repression. The top three GO terms for each time point are indicated. c, Distribution of repressed genes. Each gene repressed in this study was plotted according to the time it is first repressed (panels from top to bottom), the number of tested patterns which repress it (x axis) and the number of abiotic stresses in the AtGenExpress dataset which also repress it within the first 3 h (y axis). The color of each dot indicates the most negative log2(FC) observed in this study.

