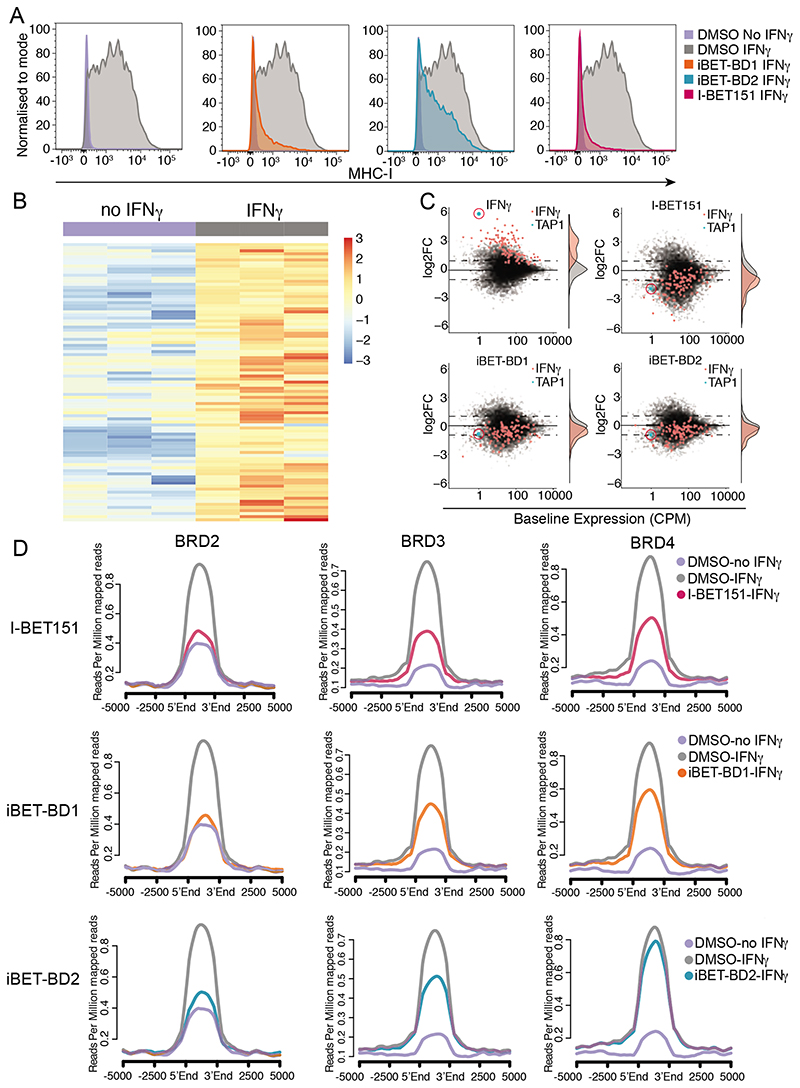
Fig. 3. BET-BD2 is required for activation of IFNg target genes.
(A) FACS analysis of MHC-I expression using antibodies against HLA-A/B/C in K562 cells following stimulation with IFNg (10ng/ml) and treatment with DMSO, iBET-BD1, iBET-BD2 or I-BET151 for 48 hrs. (B) Hierarchical clustering heatmap from SLAM-seq data in K562 cells showing upregulated genes following IFNg treatment for 6 hrs. (C) Scatter plot of differential expression of all genes (grey) and genes significantly upregulated by IFNg (red) in K562 cells, scatter plot and histogram shown for DMSO, iBET-BD1, iBET-BD2 and I-BET151. (D) Average profile plot of BRD2, BRD3 and BRD4 at genomic loci where H3K27ac levels increase following stimulation with IFNg in K562 cells for 6hrs.

