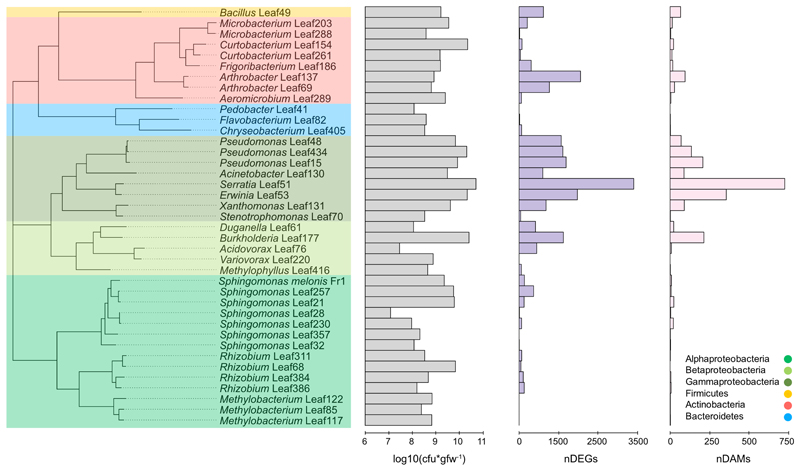
Figure 1. Magnitude of the Arabidopsis response to bacterial colonization at the transcriptional and metabolic levels.
Phylogenetic tree of bacterial strains colored according to phyla and class (see legend). First bar-chart (grey) displays the average cell number reached in the phyllosphere in cfu*gfw-1 nine days after inoculation. The second (purple) and third (rose) bar-charts display the response strength in nDEGs and nDAM in the respective condition. Data from five independent biological replicates, each representing 18-24 plants.

