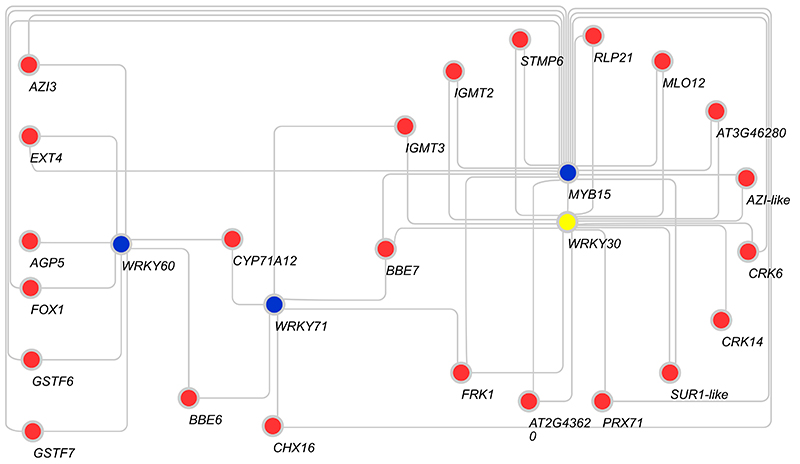
Extended Data Figure 10. Gene expression correlation of GNSR and transcription factor encoding genes.
Network graph showing significant, positive correlations (Spearman correlation, ρ ≥ 0.85, best two correlations) between GNSR genes and transcription factors of the defense associated MYB and WRKY families. GNSR genes are displayed in red, transcription factor genes in blue. WRKY30 in yellow as it is both a GNSR and a transcription factor gene.

