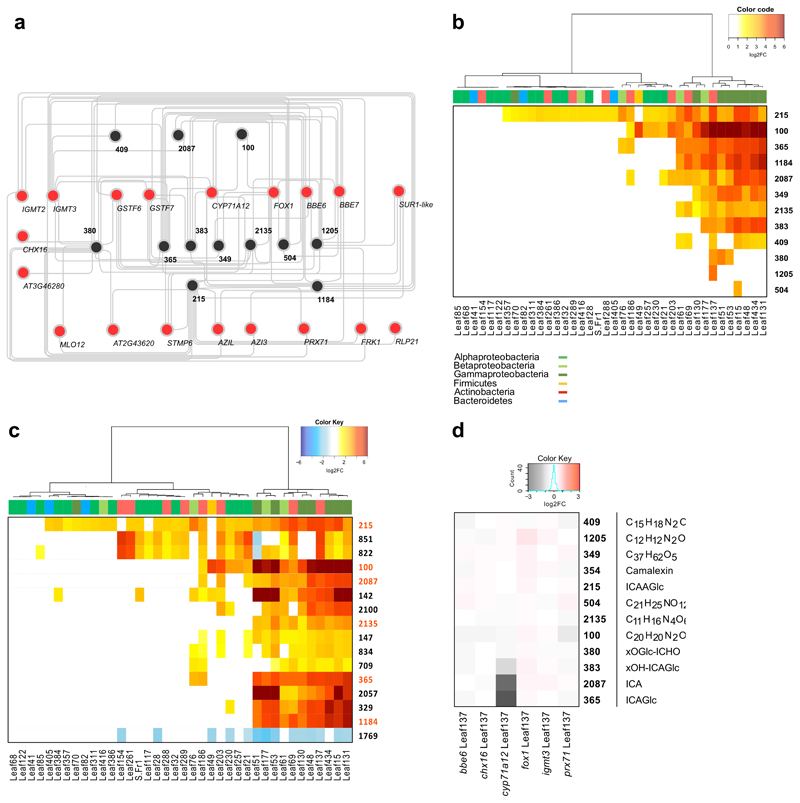
Figure 3. Correlation-analysis of GNSR and metabolome.
a, Correlation network of GNSR genes (red) with metabolites (black). Edges signify the top 2 positive correlations (Spearman’s ranked correlation, ρ > 0.85, p-value < 0.01, p-value adjustment: Benjamini-Hochberg) between the log2-transformed normalized count data against the log2-transformed normalized peak area for each independent biological replicate (n = 5). b-c, Heat-map showing significant changes (log2FC > 1, FDR < 0.05) of compounds (as crids) against wild-type (Col-0) control plants within the dataset (n = 5 independent biological replicates). Strains clustered by Ward’s method. Strain phylogeny is depicted by top color bar. (b) depicts GNSR associated compounds, (c) shows the most abundant compounds in the entire data set, with GNSR associated compounds marked orange (y-axis) d, Heat-map of log2-transformed fold changes of metabolite abundances in GNSR gene mutants inoculated with Arthrobacter Leaf137 against equally treated wild-type plants. (n = 10 technical replicates of 3 plants). For each crid, either the compound name or the predicted molecular formula is provided.

