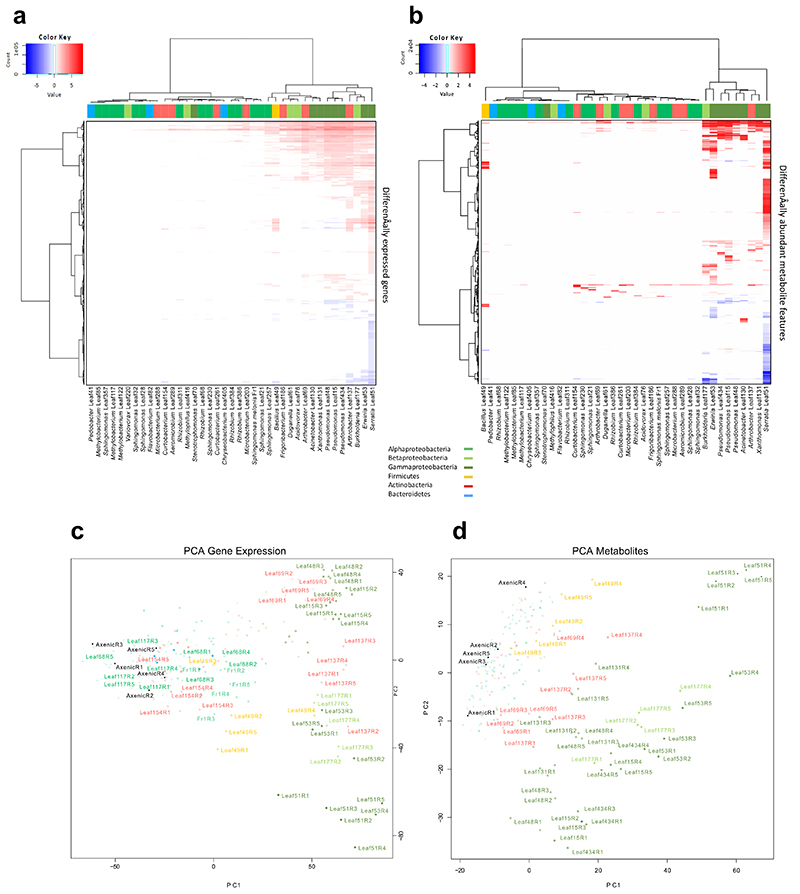
Extended Data Figure 2. Cluster analysis of DEGs and DAMs of Arabidopsis in response to bacterial treatments.
a-b, Heat-maps of total DEGs (|log2FC| > 1. FDR < 0.01) (a) and DAMs (|log2FC| > 1, FDR < 0.05) (b). Strains and DEGs/DAMs are clustered using Ward’s method. Top color bars indicate phylogeny. c-d, Principle component analysis (PCA) plot depicting distances based on gene expression counts (for DEGs) or metabolite areas under the curve (for DAMs). Colors represent bacterial phyla/classes. Selected treatments are annotated with strain name and replicate number. Data from five independent biological replicates (R1-R5), each representing 18-24 plants.

