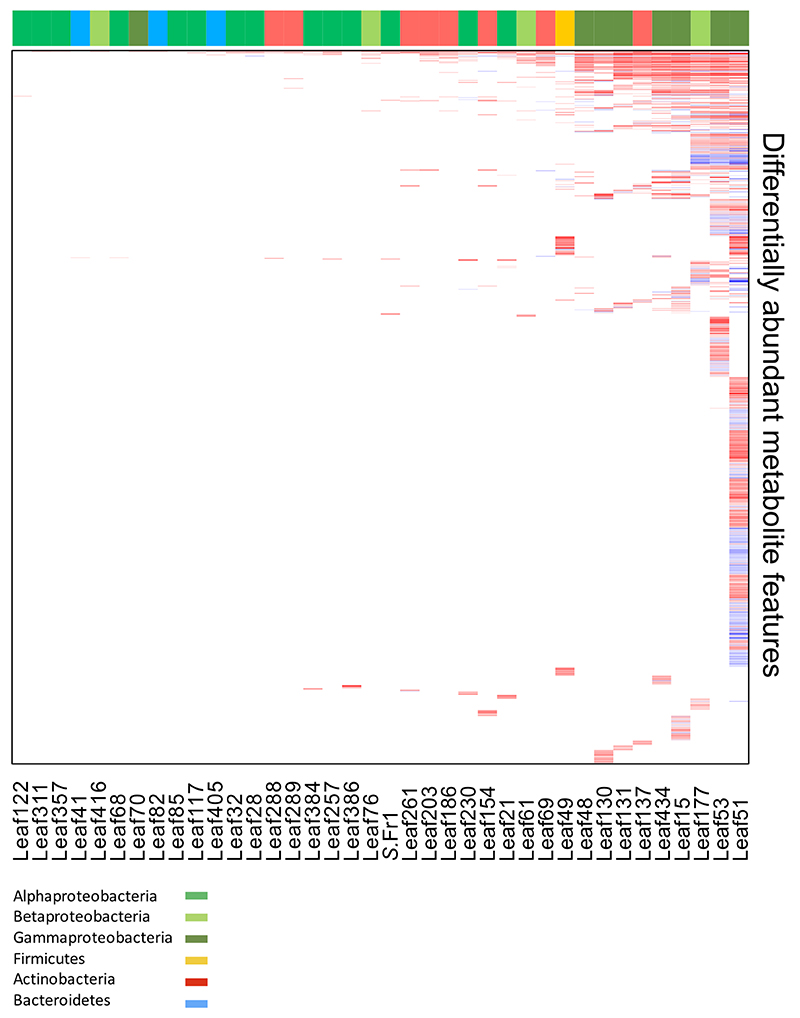
Extended Data Figure 4. Hierarchy heat-map of DAMs.
Sorted heat-maps of total DAMs (log2FC < 1, FDR < 0.05). Conditions were sorted by strains causing the weakest to strongest host-response based on the number of DAMs (x-axis, left to right) and amount of times a metabolite feature was differentially regulated from most frequent to least frequent (y-axis, top to bottom). Top color bars indicate bacterial phyla/classes analogous to Extended Data Fig. 2. Data from five independent biological replicates, each representing 18-24 plants.

