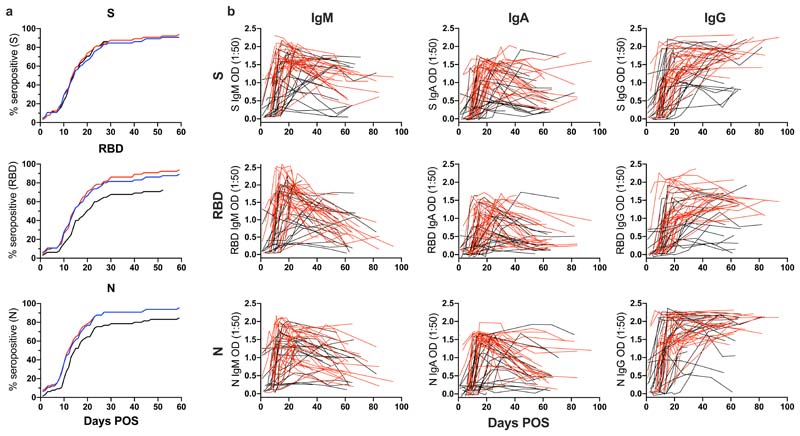
Figure 1. Kinetics of antibody development against SARS-CoV-2 antigens over time.
A) A cumulative frequency analysis describing the point of seroconversion for each person in the cohort. Graph shows the percentage of individuals in the cohort that become IgM, IgA or IgG positive to S, RBD and N each day post onset of symptoms. A serum sample is considered positive when the OD is 4-fold above background. B) OD values at 1:50 serum dilution for IgM, IgA and IgG against S, RBD and N overtime. Each line represents one individual. Severity 0-3 are shown in black and severity 4/5 are shown in red. Development of the ELISA assay is described in Pickering et al 6.

