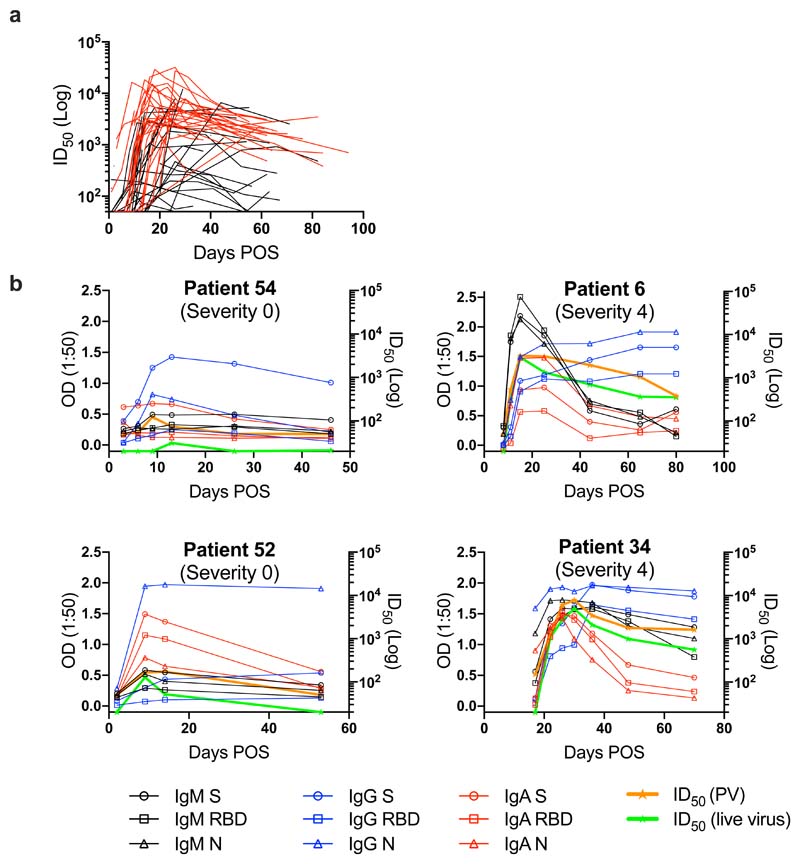
Figure 2. Kinetics of neutralizing antibody responses in SARS-CoV-2 infection.
a) nAb ID50 change related to days POS. ID50 measured using HIV-1 based virus particles (PV), pseudotyped with SARS-CoV-2 S. Each line represents one individual. Severity 0-3 are shown in black and severity 4/5 are shown in red. b) Example kinetics of Ab responses (IgM, IgA, IgG binding to S, RBD and N, and ID50 against PV and wild type virus) for four individuals during acute infection and the convalescent phase. Graphs show comparison between severity 0 (left) and severity 4 (right) rated disease. The cut-off for the pseudovirus and wild-type virus neutralization assays are 1:50 and 1:20 respectively. Error bars for OD values represent the range of the value for experiments performed in duplicate (not shown when smaller than symbol size).

