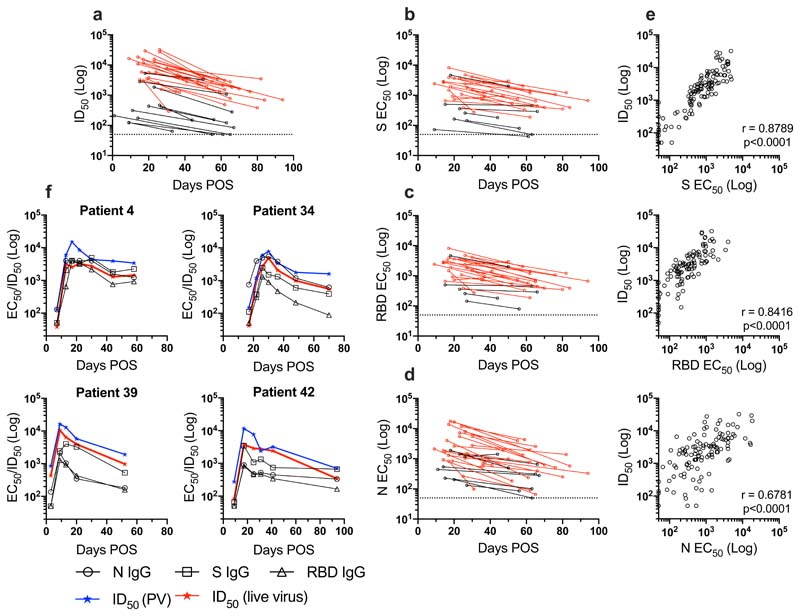
Figure 4. Longevity of the nAb response.
a) ID50 at peak neutralization (measured using HIV-1 based virus particles, pseudotyped with SARS-CoV-2 S) is plotted against the donor matched ID50 at the last time point sera was collected. Only individuals where the peak ID50 occurs before the last time point, and where the last time point is >30 days POS are included in this analysis. The dotted line represents the cut-off for the pseudovirus neutralization assay. b-c) EC50 values for IgG binding to S, RBD and N were calculated at time points with peak ID50 and the final time point sera was collected. EC50 at peak neutralization is plotted with the donor matched EC50 at the last time point sera was collected. Individuals with a disease severity 0-3 are shown in black and those with 4/5 are shown in red. The dotted line represents the cut-off for EC50 measurement. e) Correlation of ID50 with IgG EC50 against S (r 2=0.8293), RBD (r 2=0.7128) and N (r 2=0.4856) (Spearman correlation, r. A linear regression was used to calculate the goodness of fit, r 2). f) Change in IgG EC50 measured against S, RBD and N and ID50 using pseudovirus and wild type virus over time for 4 example patients (all severity 4). The lowest dilution used for the pseudovirus and wild-type virus neutralization assays are 1:50 and 1:20 respectively.

