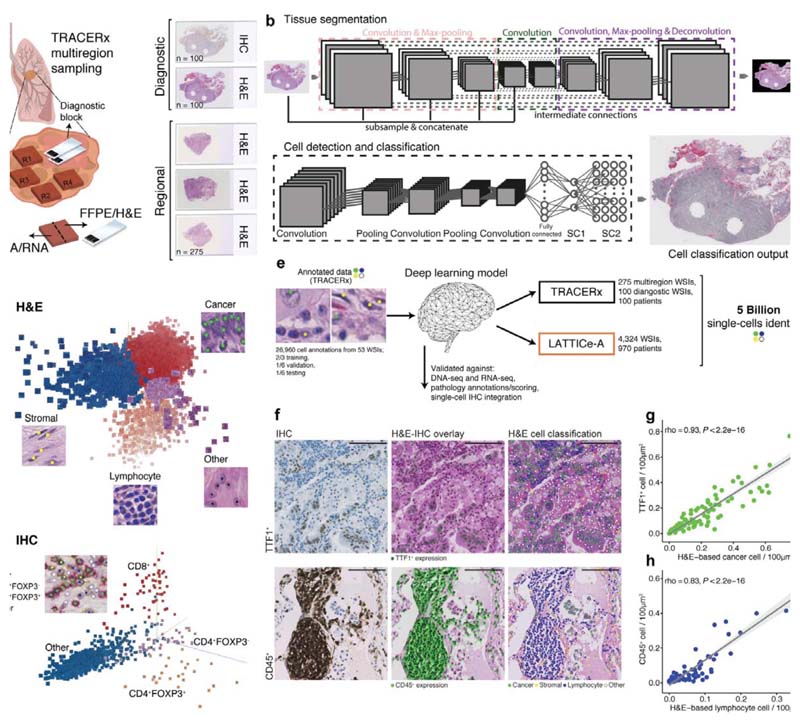
Figure 1. The computational pathology deep learning pipeline for dissecting heterogeneous NSCLC tumor microenvironment.
a. Histology sample generation in Lung TRACERx. To preserve morphology and generate good quality histology, samples from the same tumor regional frozen blocks specifically collected for TRACERx and generated molecular data1,6 were re-embedded in formalin fixed paraffin (FFPE). From these, H&Estained tumor section slides were generated. In addition, H&E section and triplex CD4/CD8/FOXP3 IHC slides were also generated from diagnostic blocks that represent clinical standard sampling, b. Our multistage deep learning pipeline consists of three key stages: fully automated tissue segmentation, single-cell detection and classification. The final output is shown as an image with all cells identified. For more details, please see the ‘Training the deep learning pipeline’ section of the Methods. c. Illustrative 3-dimensional distribution of input image patches in the feature space learned by the convolutional neural networks, using Principal Component Analysis. The feature clusters were pseudocolored to display segregation for four cell types in H&E, and d CD8+, CD4+FOXP3+, CD4+FOXP3- and “other” cell class (hematoxylin cells) in IHC, respectively, e. The deep learning single-cell classification model was trained using expert pathology annotations from a variety of TRACERx samples (diagnostic, regional, TMA). The trained model was then applied to the remaining TRACERx samples (predominantly LUAD and LUSC) and the LATTICe-A cohort (only LUAD), identifying over 171 million cells in TRACERx and over 4.9 billion cells in LATTICe-A. WSI: whole-section image, f. Biological validation of the deep learning approach. H&E and IHC images generated from the same TMA slide were virtually integrated for comparison of H&E-based cell classification and cell type marker expression. For each marker, the experiment was conducted once using a single TMA (cores/patients = 48 TTF1; 38 CD45). Scale bars represent 100μm. g-h. Correlations between cancer/lymphocyte cell percentage determined by H&E and TTF1+ (tumor marker)/CD45+ (immune marker)cellpercentage per LUAD image tilesof size 100μm2 ( = 100 TTF1; 83 CD45). The shading indicates 95% confidence interval.

