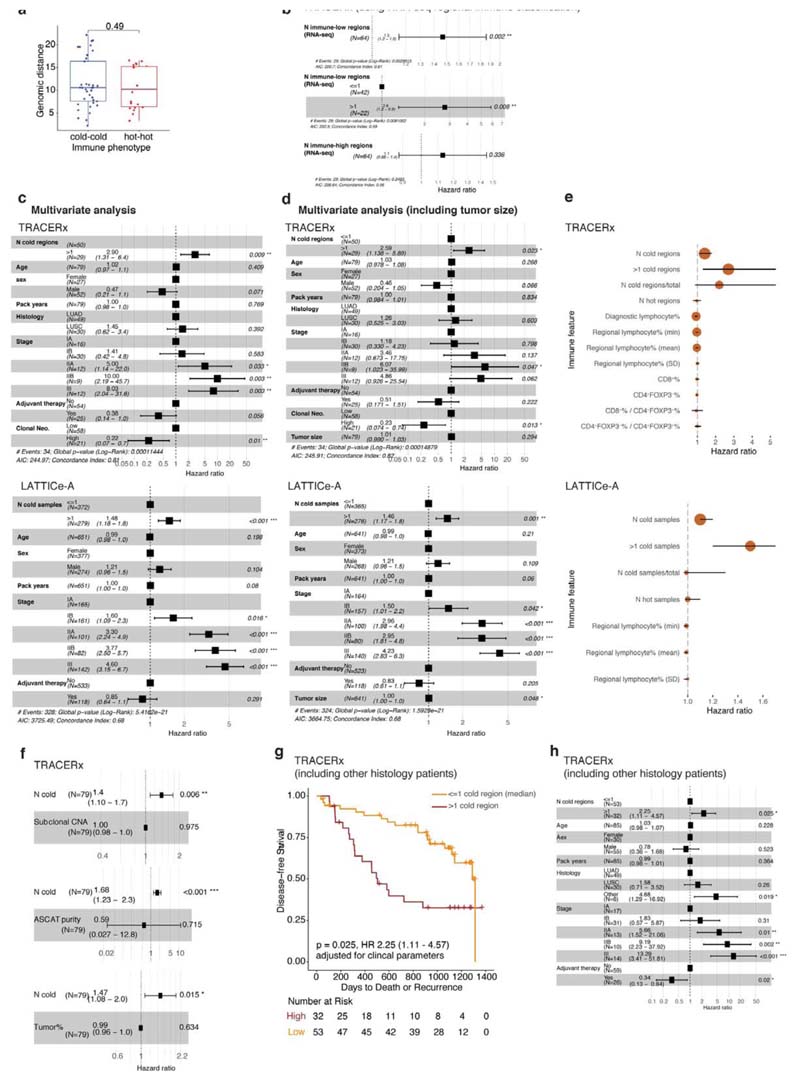
Extended Data Fig. 6. Genomic and survival analysis of tumor regions according to immune phenotypes.
a. A box plot showing the difference in genomic distances for pairs of immune hot versus immune cold regions within the same LUSC patients (= 59 pairs). A two-sided, non-parametric, unpaired, Wilcoxon signed-rank test was used. b. Forest plots to show the univariate prognostic value for the number of immune low regions (both as continuous and dichotomized at the median (≤1 versus >1)), or the number of immune high regions, using the immune classification generated by RNA-seq-based infiltrating immune cell populations1 in 64 TRACERx tumors (41 LUAD, 16 LUSC and 7 other histology subtypes). c. Forest plots showing multivariate Cox regression analyses in both TRACERx (= 79 patients; LUAD and LUSC combined) and LATTICe-A (= 651 LUAD patients representing a subset with complete stage and smoking pack years data) with the number of immune cold regions dichotomized at the median (≤1 versus >1). This remains significant when the number of immune cold regions was replaced as a continuous variable, in the same multivariate model, (R = 0.019 in TRACERx and < 0.001 in LATTICe-A, for the number of immune cold regions). Clonal neoantigens were dichotomized using the upper quartile, determined individually for LUAD and LUSC tumors1. d. The same test in c when tumor size (in mm) was also controlled in the multivariate model in LATTICe-A. This test also remained significant for a bigger group of patients with complete stage data, but missing pack years information (= 815, R < 0.001, HR = 1.4[1.1-1.8]). e. Forest plots to compare the prognostic value of regional immune scores as well as diagnostic H&E and IHC scores for relapse-free survival in TRACERx (= 79 patients, LUAD and LUSC combined). Wherever possible, these immune features were tested in LATTICe-A (= 970 patients). To compare the prognostic value of the number of immune cold region with other immune features, LATTICe-A comparisons were conducted in Cox multivariate regression models to include every immune feature after correcting for the number of immune cold regions in the same model. Each variable’s HR is plotted with a 95% confidence interval; all R-values were adjusted for multiple testing; and the size of the circles denotes–log10(R). For the sake of visualization, a minor adjustment was made to the HR for the number of cold regions/total number of regions in LATTICe-A from 0.88[0.57-1.3] to 0.99[0.97-1.3], SD: standard deviation, used for measuring variability of lymphocyte percentage among samples within a tumor, f. Forest plots using Cox multivariate regression analysis showing that the prognostic value of the number of immune cold regions was independent of: 1) genetic measure, subclonal copy number alteration (obtained from 6); 2) tumor cellularity from DNA-seq-based ASCAT purity, 3) tumor cellularity measured by deep learning-based cancer cell percentage, g. Kaplan Meier curves to illustrate the difference in relapse-free survival for TRACERx patients including other histology types (= 85; representing all TRACERx patients in the multiregion histology cohort) with high and low number of immune cold regions, dichotomized by its median value. Log-rank R = 0.0017. h. Forest plot using Cox regression for the multivariate survival analysis for the number of immune cold regions in TRACERx including patients with other histology subtypes (= 85).

