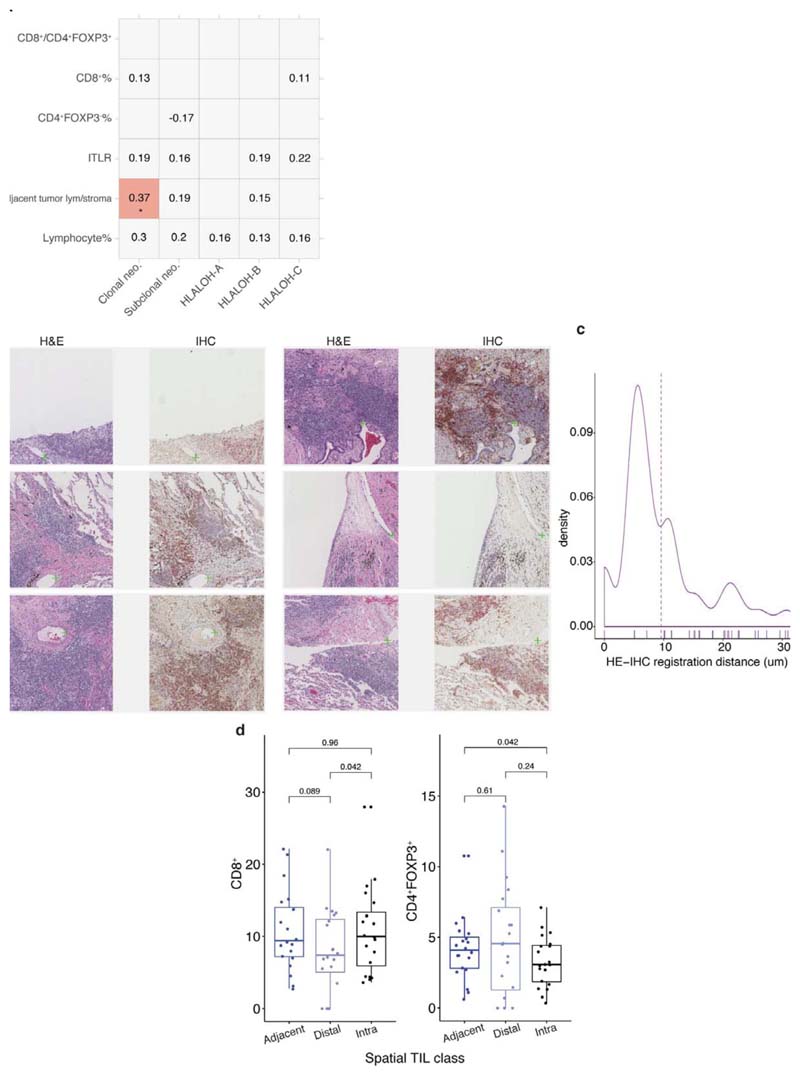
Extended Data Fig. 8. Relationship of immune subsets and spatial TILs in LUAD.
a. Spearman’s correlations between immune scores in diagnostic slides and genetic measures including predicted neoantigens and HLALOH in LUAD patients (= 46). ITLR: intra-tumor lymphocytes to total tumor cell ratio. Only significant correlations after multiple testing are highlighted (rho = 0.37, R = 0.035). b. Examples of registered H&E and IHC tiles. The green cross denotes a manually placed landmark repeated 238 times on pairs of H&E-IHC image tiles. The Euclidean distance (difference in, coordinates) was computed between the two landmarks which was then c. shown as a distribution to represent the accuracy of the registration (= 249 total H&E-IHC image tiles, maximum five landmarks per a pair of tiles). The average distance between matching landmarks was 9.57μm and the distribution is within the expected range of maximum distance between four serial sections (16μm). d. Box plots to illustrate the difference in percentage of immune cell subsets among adjacent, intra and distal-tumor lymphocytes (= 20 image tiles), a non-parametric, paired Wilcoxon test was used.

