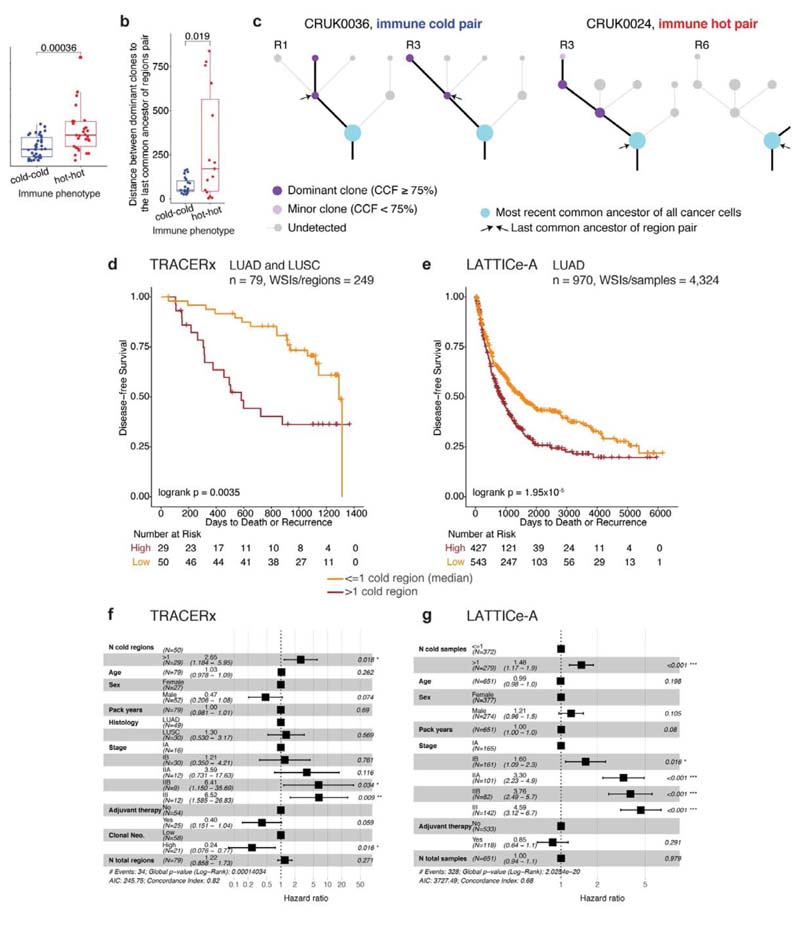
Figure 3. Evolution of immune escape, and survival analysis in TRACERx and LATTICe-A.
a. A box plot showing the difference in genomic distances for pairs of immune hot or immune cold regions within the same patients in LUAD (= 66 pairs), b. A box plot showing the difference in mutational distance between the dominant subclones in pairs of immune hot or immune cold regions via their last common ancestor in LUAD (= 23 immune cold pairs; 15 immune hot pairs). This distance was calculated by taking the furthest dominant clone (cancer cell fraction (CCF) ≥ 75%) from the trunk, and it remained significant when the dominant clone closest to the most recent common ancestor of each tree was considered (R = 0.02). c. Illustrative examples of tumor phylogenetic trees for a pair of immune hot and immune cold regions. Dominant subclones were labelled and their last common ancestor (annotated with arrows) was then identified. Minor (CCF < 75%) or undetected clones were neglected in this analysis. d,e. Kaplan-Meier curves illustrating the difference in disease-free survival according to the number of immune cold regions, dichotomized by the median value, in TRACERx (d) (LUAD and LUSC, = 79 patients, 249 regions) and LATTICe-A (e) (LUAD, = 970 patients, 4,324 samples). The same deep learning histology analysis and immune regional classification developed for TRACERx were applied directly to LATTICe-A. WSI: whole-section image, f. Forest plots showing multivariate Cox regression analyses in TRACERx (= 79 patients; LUAD and LUSC). Clonal neoantigens were dichotomized using the upper quartile, determined individually for LUAD and LUSC tumors1. g. Forest plots showing multivariate Cox regression analyses in LATTICe-A (= 651 LUAD patients with complete stage and smoking pack years data). For the patient subset with complete stage data but missing pack years information, the test remained significant (= 827, R < 0.001, HR = 1.4[1.1-1.9]). For statistical comparisons among groups, a two-sided, non-parametric, unpaired, Wilcoxon signed-rank test was used, unless stated otherwise.

