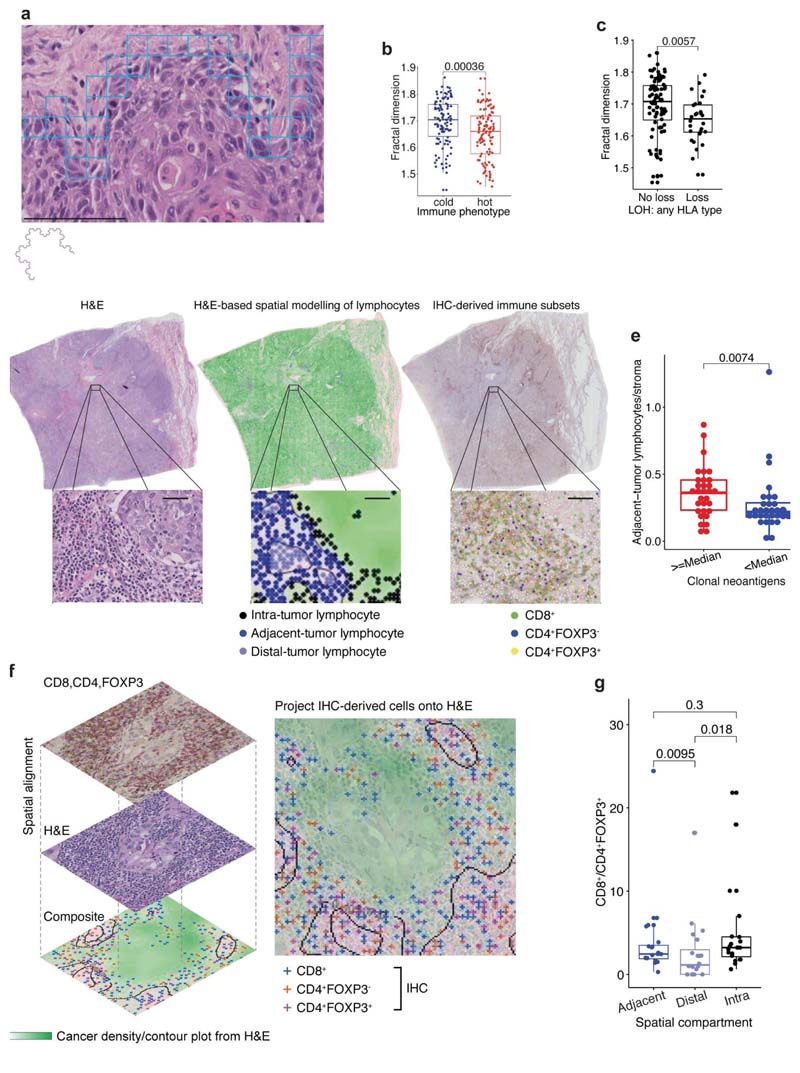
Figure 4. Association of spatial histology with genetic alterations relevant to immune surveillance.
a. An illustrative example of fractal dimension calculated by the box-counting algorithm to quantify the geospatial complexity of the cancer cell-stromal cell interface. By examining boxes of decreasing sizes that contain both cancer and stromal cells, the box counting algorithm quantifies the rate at which the geometrical details of cancer-stromal interface develop at increasingly fine scales. Blue box illustrates the smallest box of 20μm by 20μm in size. Scale bar represent 100μm. An example of a fractal structure displaying geometrical self-similarity is shown below the panel, b. A box plot to illustrate the significant difference in fractal dimension between all TRACERx immune hot and cold regions (= 219). c. A box plot showing a significant difference in fractal dimension between LUAD tumor regions (= 116) harboring an LOH event for class 1 HLA of any type versus regions that do not, adjusted for multiple comparisons with the remaining HLA type-specific tests (see Extended Data Fig. 7f). d. Illustration of the adjacent-tumor lymphocyte/stroma ratio inferred by spatial modeling of cancer cell density (contours) and lymphocyte classification into spatial compartments. Cell classification in IHC sample of the same block was shown for comparison. Scale bars represent 50μm. e. A box plot showing the difference in the adjacent-tumor lymphocyte/stroma ratio between high (≥ median) and low (< median) clonal neoantigens for all LUAD patients in TRACERx (= 61). f. Illustration of image registration to spatially align serial sections of H&E and IHC and generate a virtual composite map of T cell subset in the context of cancer/stroma density. T cell subsets classified in the IHC were projected onto the cancer density map inferred from H&E, so that they can be classified into adjacent-tumor, intra-tumor, and distal-tumor compartments, g. A box plot showing significantly higher ratio of CD8+ to CD4+FOXP3+ cells in adjacent-tumor and intratumor lymphocytes compared with distal-tumor lymphocytes in registered LUAD image tiles (= 20 image tiles, using paired Wilcoxon test). For statistical comparisons among groups, a two-sided, non-parametric, unpaired, Wilcoxon signed-rank test was used, unless stated otherwise.

