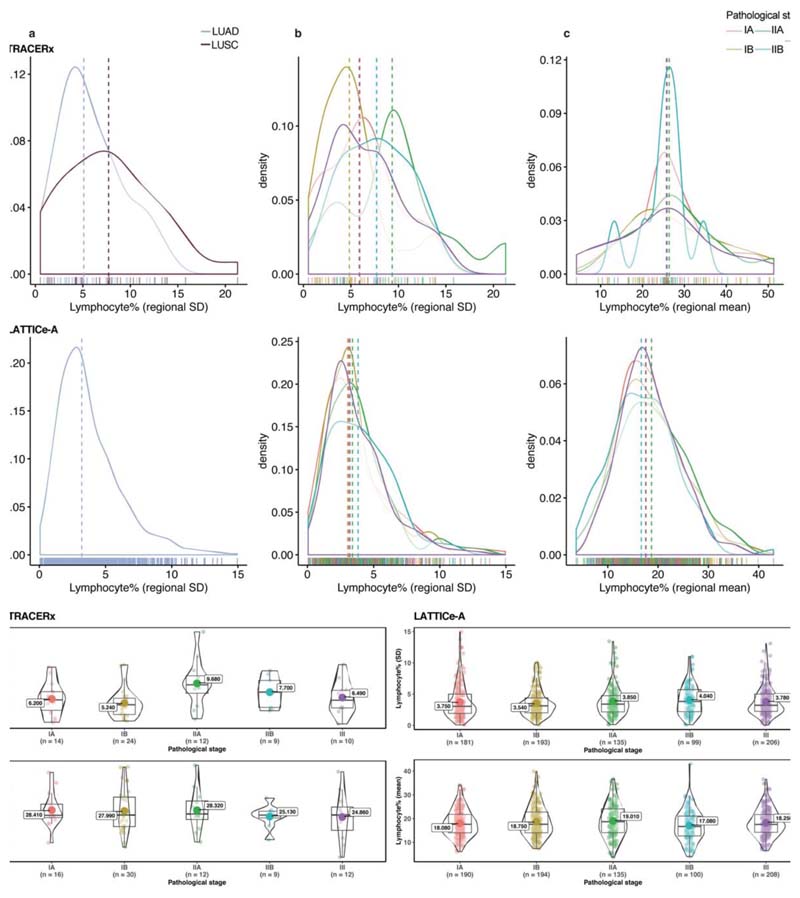
Extended Data Fig. 3. Distribution of regional lymphocytic infiltration according to pathological stage.
All available patients’ data have been used in this figure except for the standard deviation tests excluding patients with a single tumor region. Patients without pathological staging information from the LATTICe-A cohort were also removed. a, b, c, top row: TRACERx and bottom row: LATTICe-A. Horizontal lines indicate the median value. a. Distribution of the standard deviation of regional lymphocyte percentage for LUAD and LUSC patients in TRACERx (= 69), and LUAD in LATTICe-A (= 814). b. Distribution of the standard deviation of regional lymphocyte percentage across pathological stages (= 69 for TRACERx, 814 for LATTICe-A). c. Distribution of regional mean of lymphocyte percentage across stages (= 79 for TRACERx, 827 for LATTICe-A). d. No significant difference among stages with respect to standard deviation (= 69 for TRACERx, 814 for LATTICe-A) or mean (= 79 for TRACERx, 827 for LATTICe-A) of regional lymphocytic infiltration. Left panel, TRACERx and right panel, LATTICe-A. Correction for multiple testing was applied in d, for each cohort individually. A two-sided, non-parametric, unpaired, Wilcoxon signed-rank test was used; each dot represents a patient; the mean value is annotated with a large dot; the median value is represented by a thick horizontal line; minimum and maximum values are indicated by the extreme points; the first and third quantiles are represented by the box edges; and the violin shape shows the data distribution as a kernel density estimation.

