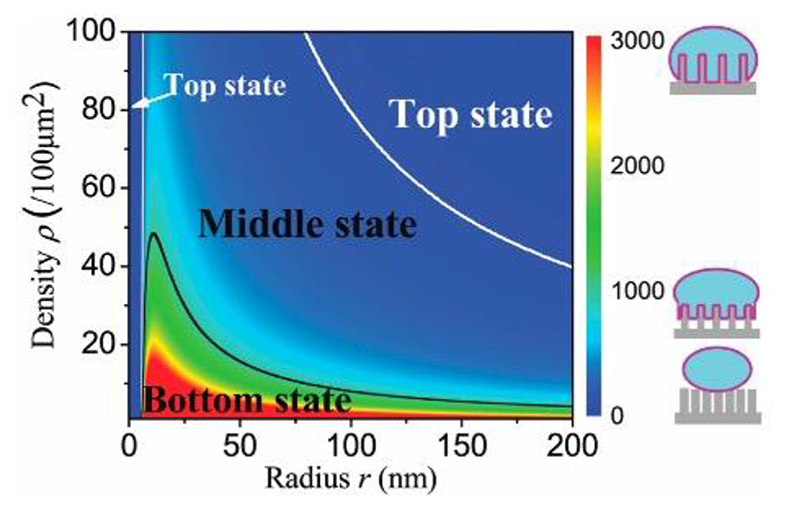
Figure 12.
A phase-diagram illustrating the output from the cell-settling model of Zhou et al. The color scale indicates the degree of adhesion depth (i.e. how far the cell sinks into the nanostructures). The black and white lines indicate the boundary for cells either being a fully-engulfed ‘bottom’ or ‘top’ state. Reproduced with permission.[118] Copyright 2018, Royal Society of Chemistry.

