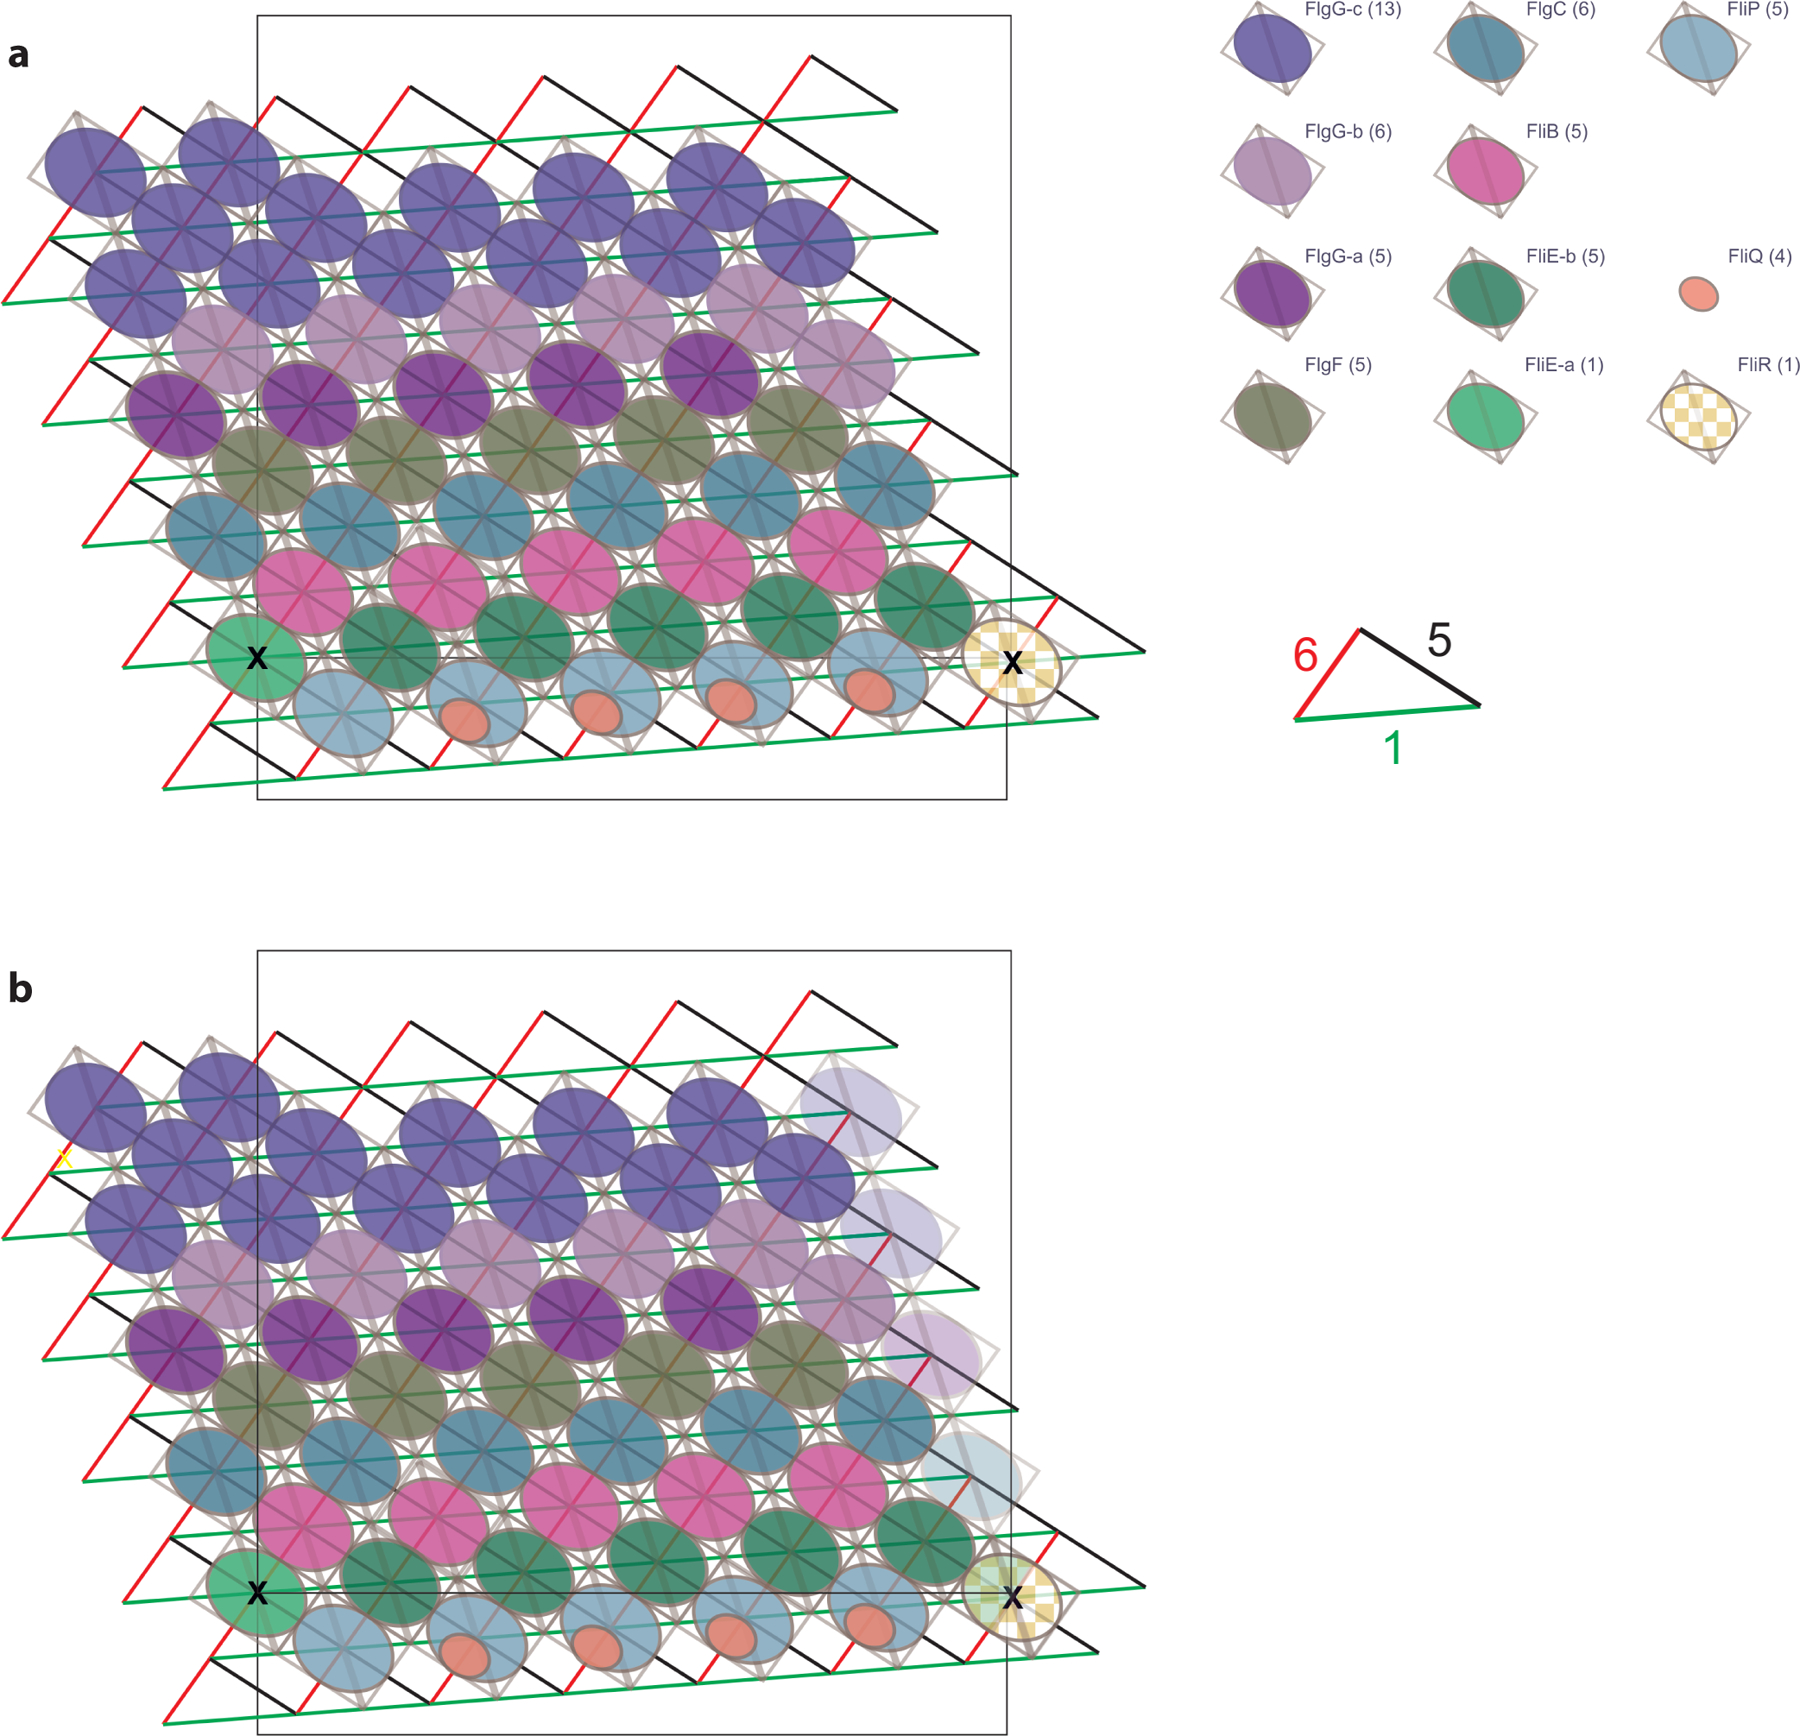
Extended Data Fig. 5. Analysis of the rod helical lattice.

a, Representation of the helical symmetry of the rod, with the different X-start helices highlighted. Protein subunits are represented as ellipses, colored as in Figure 2. The lattice node shared by FliR and FliE-a is highlighted. b, Alternative representation of the lattice with ‘ghost’ additional protofilament to show how the structure closes.
