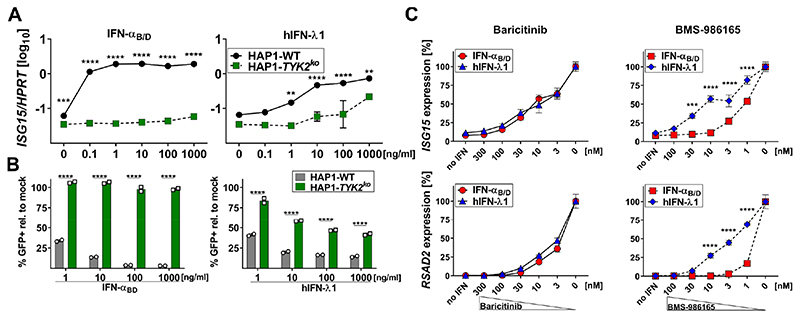
Figure 4. TYK2 inhibition preferentially inhibits type I IFN-mediated gene expression in human HAP1.
(A)HAP1-WT or HAP1-TYK2ko cells were treated with increasing concentrations of IFN-αB/D or hIFN-λ1 for 4 h. Expression levels of ISG15 were quantified relative to HPRT. Symbols represent means ± SD, data representative of two independent experiments with n = 2 per experiment. Statistical analysis: ****P<0.0001, ***P<0.001 and **P<0.01, by two-way ANOVA with Sidak’s multiple comparisons test.
(B)HAP1-WT or HAP1-TYK2ko cells were treated with increasing concentrations of IFN-αB/D or hIFN-λ1 for 16 h before infection with VSV-GFP (MOI~1) for 6 h. Data is shown as percentage of GFP-positive cells normalized to mock-treated controls infected with VSV-GFP. Bars represent means ± SD, data representative of two independent experiments with n = 2 per experiment. Statistical analysis: ****P<0.0001, by two-way ANOVA with Sidak’s multiple comparisons test.
(C) HAP1-WT cells were treated with the indicated concentrations of the JAK1/2 inhibitor baricitinib (left panels) or the selective TYK2 inhibitor BMS-986165 (right panels) for 1.5 h before 0.1 ng/ml IFN-αB/D or 10 ng/ml hIFN-λ1 was added to the medium. After 4 h gene expression levels of the representative ISGs ISG15 and RSAD2 were quantified relative to the housekeeping gene HPRT. JAK-inhibitor-mediated inhibition of IFN-mediated gene expression is indicated as percentages of maximum gene expression levels without inhibitor. Symbols represent means ± SEM, data are pooled from three independent experiments with a total n = 6-10. Statistical analysis: ****P<0.0001 and ***P<0.001, by two-way ANOVA with Sidak’s multiple comparisons test.

