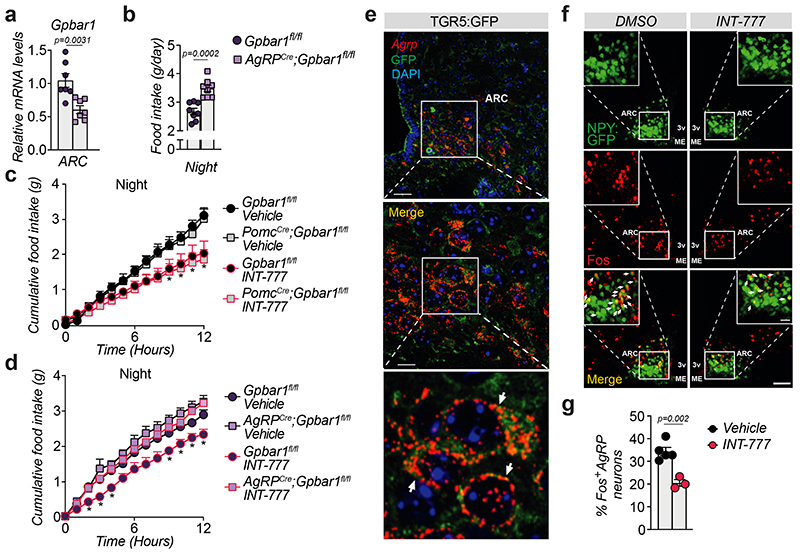
Figure 3. Selective deletion of TGR5 in AgRP/NPY but not in POMC neurons abrogates satiety induced by BA derivatives.
(a) Gpbar1 mRNA levels in arcuate nucleus (ARC)-enriched hypothalamic punches of control mice (Gpbar1fl/fl) and AgRP neuron-specific TGR5 knock-out (AgRPCre;Gpbar1fl/fl) mice. n=7 animals. (b) 12-hours food intake of Gpbar1fl/fl and AgRPCre;Gpbar1fl/fl mice. n=8 animals. (c) 12-hour cumulative food intake of control (Gpbar1fl/fl) and POMC neuron-specific TGR5 knock-out (PomcCre;Gpbar1fl/fl) mice after oral administration of TGR5 agonist INT-777 or vehicle. n=6 (Gpbar1fl/fl INT-777), n=7 (Vehicle groups) and n=8 (PomcCre;Gpbar1fl/fl INT-777) animals. (d) 12-hour cumulative food intake of control (Gpbar1fl/fl) and AgRP neuron-specific TGR5 knock-out (AgRPCre;Gpbar1fl/fl) mice after oral administration of TGR5 agonist INT-777 or vehicle. n=7 (Gpbar1fl/fl INT-777) n=8 (all other groups) animals. (e) Representative images showing Agrp mRNA (in red) using RNAscope technique together with TGR5 immunodetection (GFP) in green and nuclei staining (DAPI) in blue in the acuate nucleus (ARC) of TGR5:GFP mice (n=4 animals). Arrows in the lower panel (digital zoom image) indicate cells that co-express Agrp mRNA (in red) and GFP protein (in green). Colocalization between Agrp and GFP is shown in orange (merge). Scale bars = 50 μm and 10μm plus digital zoom in the image below. (f-g) Representative images (f) and quantification (g) of Fos immunoreactivity (in red) in AgRP/NPY neurons (in green) and merge (in orange) in the hypothalamus of AgRP/NPY-GFP expressing mice after oral administration of INT-777 (n=3 animals) or vehicle (n=5 animals). Arrows in images indicate colocalization of Fos and GFP. Scale bar = 100 μm. Results represent mean ± SEM. n represents biologically independent replicates. Two-tailed Student’s t-test (a, b and g) or two-way ANOVA followed by Bonferroni post-hoc correction (c and d) vs. Gpbar1fl/fl (a and b), Gpbar1fl/fl vehicle for PomcCre;Gpbar1fl/fl (c), Gpbar1fl/fl vehicle for AgRPCre;Gpbar1fl/fl (d), or vehicle (g) groups were used for statistical analysis. P values (exact value or * P ≤ 0.05) are indicated in the figure.

