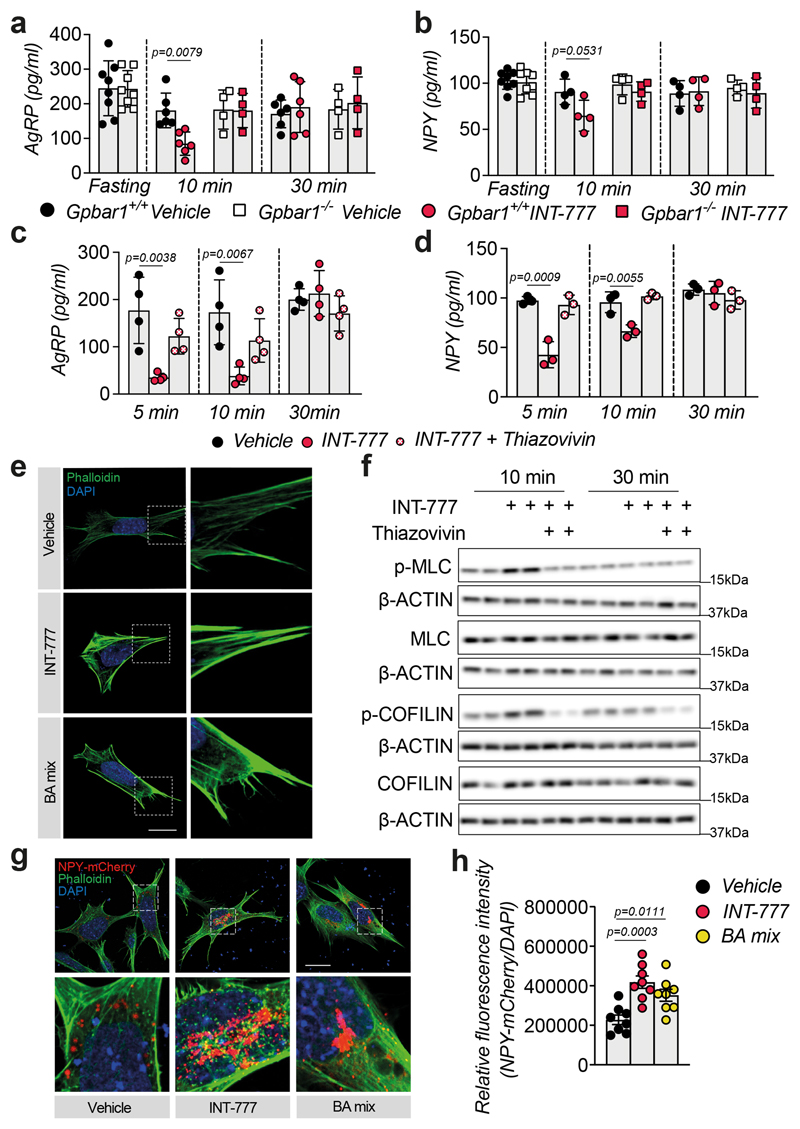
Figure 4. TGR5 regulates orexigenic neuropeptide secretion though transient activation of the Rho/ROCK signaling pathway.
(a-b) AgRP (a) or NPY (b) release in hypothalamic explants from TGR5 wild-type (Gpbar1+/+) and germline TGR5 knock-out (Gpbar1−/−) mice after starvation or 10- and 30-min stimulation with TGR5 agonist INT-777 or vehicle. n= 4 (Gpbar1−/− 10 and 30 min), n= 6 (Gpbar1+/+ 10 and 30 min) and n=8 (fasting) (a); n= 4 (Gpbar1+/+ and Gpbar1−/− 10 and 30 min) and n=8 (fasting) (b) animals. (c-d) AgRP (c) or NPY (d) release after starvation followed by short-term (5, 10 and 30 min) stimulation with TGR5 agonist INT-777, vehicle or preincubation (30 min) with specific ROCK inhibitor (thiazovivin – 10μM) followed by INT-777 stimulation in mouse embryonic hypothalamic N41 cell line (mHypoE-N41). n=4 (c) and n=3 (d) samples. (e) Representative images of phalloidin staining to detect actin fibers (in green) and DAPI staining to detect nuclei (in blue) after 10 minutes stimulation with INT-777, bile acid (BA) mix or vehicle in mHypoE-N41 cells. Scale bar = 10μm and digital zoom. n=4 samples. (f) Representative Western blot of phosphorylated or total ROCK signaling targets (MLC and COFILIN) from the cells described in c, β-ACTIN was used as loading control. n=4 samples. (g-h) Representative images (g) or quantification of fluorescence intensity (h) of NPY vesicles (in red), phalloidin staining to detect actin fibers (in green) and DAPI staining to detect nuclei (in blue) after 10 minutes stimulation with INT-777, bile acid (BA) mix or vehicle in mHypoE-N41 transfected cells. Scale bars = 10μm and digital zoom. n=8 samples. Results represent mean ± SEM. n represents biologically independent replicates. One-way ANOVA followed by Bonferroni post-hoc correction vs. Gpbar1+/+ vehicle (a and b) or vehicle (c, d and h) groups was used for statistical analysis. P values (exact value) are indicated in the figure.

