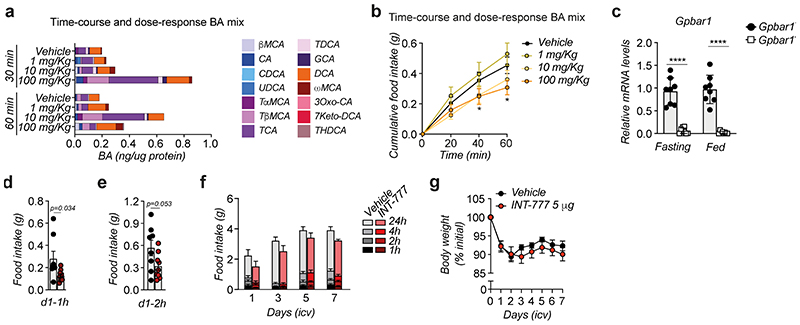
Extended Data Fig. 1. BA mix and INT-777 reach the hypothalamus after oral or icv administration, respectively, and reduce food intake by activating TGR5.
(a) Conjugated and unconjugated BA species measured in the hypothalamus 30- and 60-min after oral administration of a BA mix at three different doses or vehicle in wild-type mice (n=8 animals). Bars represent the mean from 8 replicates. (b) One-hour cumulative food intake of wild-type mice after oral administration of a BA mix at three different doses or vehicle. n=8 (Vehicle and 1 mg/Kg) and n=10 (10 mg/Kg and 100 mg/Kg) animals. (c) Gpbar1 mRNA levels in arcuate nucleus (ARC)-enriched hypothalamic punches of TGR5 wild-type (Gpbar1+/+) and germline TGR5 knock-out (Gpbar1−/−) mice. n=8 animals. (d) One-hour (1h) food intake measured after the first icv injection (d1 – 1h) of vehicle (n=8 animals) or INT-777 (n=9 animals) in wild-type mice. (e) Two-hour (2h) food intake measured after the first icv injection (d1 – 2h) of vehicle (n=8 animals) or INT-777 (n=9 animals) in wild-type mice. (f) Food intake measured after a daily (right before the dark phase) icv injection of vehicle (n=8 animals) or INT-777 (n=9 animals) in wild-type mice at the indicated time points. (g) Body weight change (expressed as a percentage of the initial body weight) of vehicle (n=8 animals) or INT-777 (n=9 animals) in wild-type mice at the indicated time points. Results represent mean (a) or mean ± SEM (b-g). n represents biologically independent replicates. Two-tailed Student t-test (c, d and e) or two-way ANOVA followed by Bonferroni post-hoc correction (b) vs Vehicle (b, d-e) or Gpbar1+/+ (c) were used for statistical analysis. P values (exact value, * P ≤ 0.05 or **** P ≤ 0.0001) are indicated in the figure.

