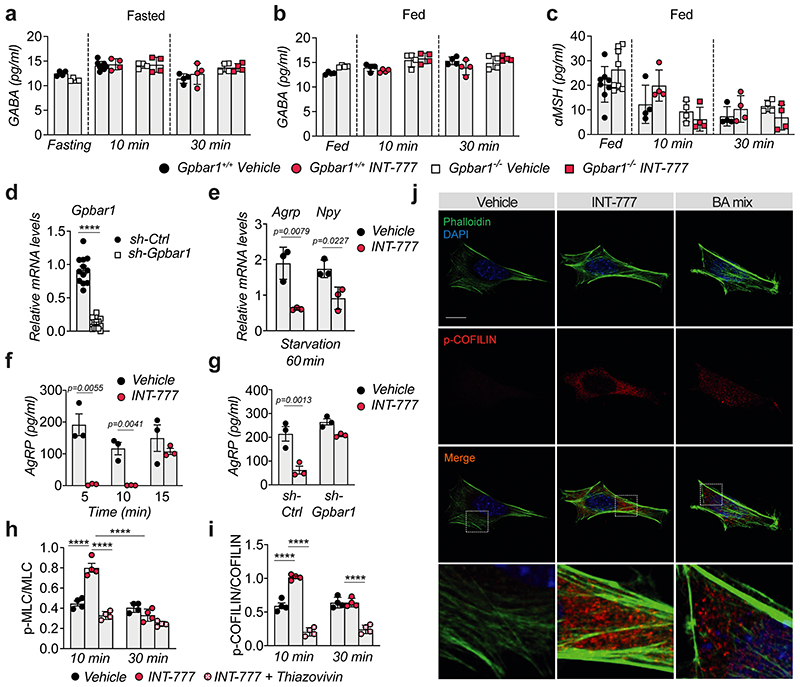
Extended Data Fig. 4. TGR5 inhibits AgRP secretion through activation of the Rho/ROCK/actin signaling axis.
(a) GABA release in ex vivo hypothalamic explants from TGR5 wild-type (Gpbar1+/+) and germline TGR5 knock-out (Gpbar1−/−) mice after starvation or starvation followed by 10- and 30-minutes stimulation with TGR5 agonist INT-777 or vehicle. n=4 (all other groups) and n=8 (Gpbar1+/+ vehicle 10 min) animals. (b-c) GABA (b) or αMSH (c) release in ex vivo hypothalamic explants from Gpbar1+/+ and Gpbar1−/− mice after high-glucose (15mM) solution to mimic fed conditions, followed by 10- and 30-minutes stimulation with TGR5 agonist INT-777 or vehicle. n=4 (b), n=4 (all other groups in c) and n=8 (Gpbar1+/+ and Gpbar1−/− fed, c) animals. (d) Gpbar1 mRNA levels in mouse embryonic hypothalamic N41 cell line (mHypoE-N41) after Gpbar1 silencing using transient transfection of sh-Gpbar1 or control vector (sh-Ctrl). n=12 samples. (e) Agrp and Npy mRNA levels in mHypoE-N41 cells after 60 min starvation conditions followed by 60 min stimulation with INT-777 or vehicle. n=3 samples. (f) AgRP release after starvation followed by short-term (5, 10 and 15 min) stimulation with TGR5 agonist INT-777 or vehicle in mHypoE-N41 cells. n=3 samples. (g) AgRP release after starvation followed by 10 min stimulation with INT-777 or vehicle in mHypoE-N41 Gpbar1-silenced cells using transient transfection of sh-Gpbar1 or control vector (sh-Ctrl). n=3 samples. (h and i) Quantitative densitometry of phosphorylated vs total ROCK signaling targets (MLC and COFILIN) from the cells described in Fig. 4f. n=4 samples. (j) Representative images of phalloidin staining to detect actin fibers (in green) and DAPI staining to detect nuclei (in blue), phosphorylated COFILIN (p-COFILIN) immunodetection (in red) and merge, after 10 min stimulation with INT-777, BA mix or vehicle in mHypoE-N41 cells. Scale bar = 10μm and digital zoom. n=4 samples. Results represent mean ± SEM. n represents biologically independent replicates. Two-tailed Student t-test (d-f) or one-way ANOVA followed by Bonferroni post-hoc correction (g, h and i) vs. sh-Ctrl (d) or vehicle (e-i) groups were used for statistical analysis. P values (exact value or **** P ≤ 0.0001) are indicated in the figure.

