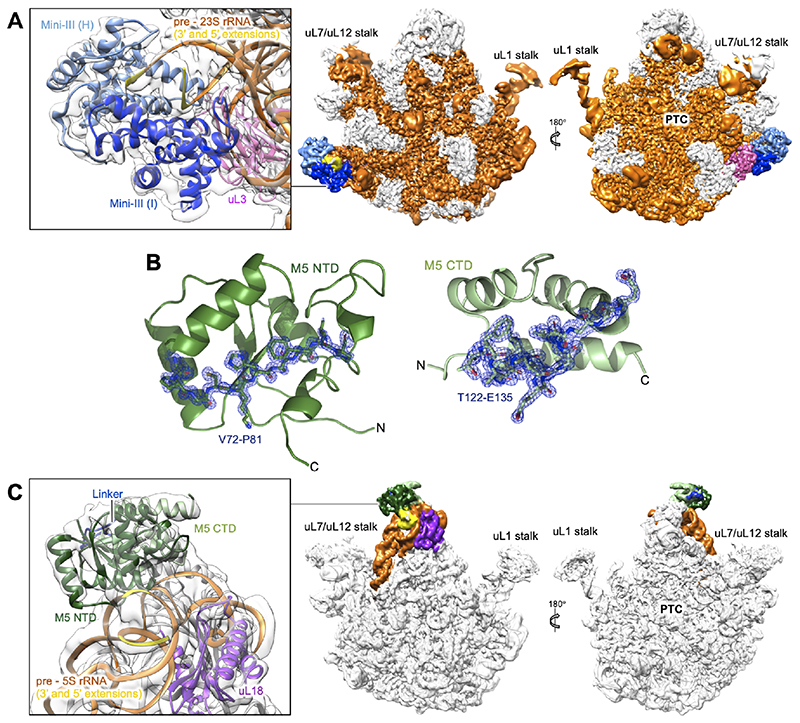
Figure 2. CryoEM density maps for Mini-III/50S(pre-23S) and M5/50S(pre-5S).
(A) CryoEM density map for the Mini-III dimer (light/dark blue) bound to the 50S(pre-23S) ribosomal particle. The pre-23S rRNA substrate (orange) and the uL3 r-protein cofactor (magenta) are highlighted. Ribosomal landmarks including the uL1 and uL7/uL12 stalks and the peptidyl transferase centre (PTC) are labelled for orientation. The insert shows a close up of the Mini-III dimer, its pre-23S rRNA substrate and the r-protein uL3.
(B) X-ray crystal structures of the M5 domains with composite omit 2Fo-Fc difference density map (blue), contoured at 2.0 σ, shown for residues T122-E135 and V72-P81 to emphasise resolution. The N- and C-terminal domains are labelled, with the M5 C-terminal domain (CTD) shown in light green (top) and the N-terminal domain (NTD) in dark green (bottom).
(C) CryoEM density map for the M5 monomer (NTD/CTD/linker in dark green/light green/blue, respectively) bound to the 50S(pre-5S) ribosomal particle. The pre-5S rRNA substrate (orange) and the uL18 r-protein cofactor (purple) are highlighted. Ribosomal landmarks including the uL1 and uL7/uL12 stalks and the peptidyl transferase centre (PTC) are labelled for orientation. The insert shows a close up of the M5 monomer, its pre-5S rRNA substrate and r-protein uL18.

