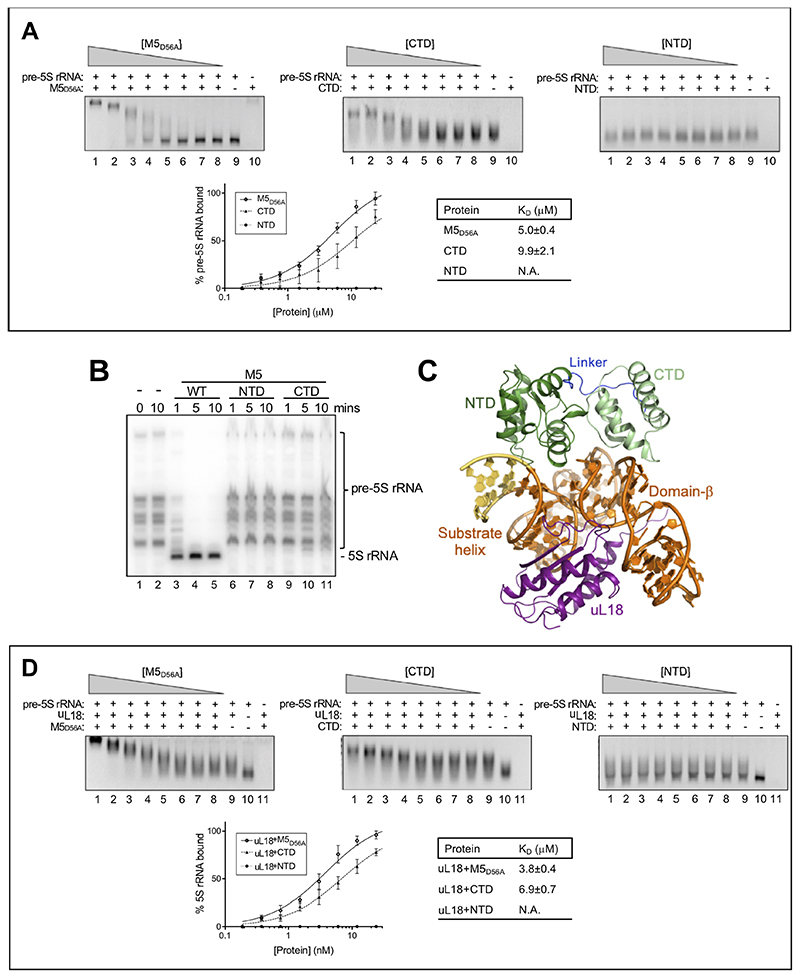
Figure 6. The role of uL18 in M5 substrate-binding and RNase activity.
(A) Top: EMSA in 2.5% native agarose gels for inactive, full-length M5D56A (first panel), M5 CTD (second panel), and M5 NTD (last panel) with in vitro transcribed pre-5S rRNA. Gels show free pre-5S rRNA (bottom band) and M5-bound pre-5S rRNA (top band) for a protein titration (lane 1-8). Lane 9 corresponds to pre-5S rRNA alone, and lane 10 to protein alone. Bottom left: plot of M5-bound pre-5S rRNA (%) as a function of M5 protein concentration. Each point represents the area-under-the-curve from band integration with the area for pre-5S rRNA alone (lane 9) set to 100%. Standard deviations are calculated from integration of bands from three independent experiments. Bottom right: KD-values determined by curve-fitting using a least-squares fit for one site with specific binding.
(B) Northern blot showing processing of pre-5S rRNA in 50S particles by M5WT, M5 NTD, or M5 CTD. Lanes 1 and 2 show the reaction at 0 and 10 minutes without M5 protein, respectively.
(C) uL18 (purple) bound to the pre-5S rRNA substrate helix and domain-β, opposite from M5 (dark/light green, linker in dark blue).
(D) As in (A), but with incubation of each sample of pre-5S rRNA with uL18 at a ratio of 1:1, prior to M5 protein titration. Protein titrations corresponds to lane 1-8, lane 9 to pre-5S rRNA + uL18, lane 10 to pre-5S rRNA alone, and lane 11 to M5 protein + uL18.

