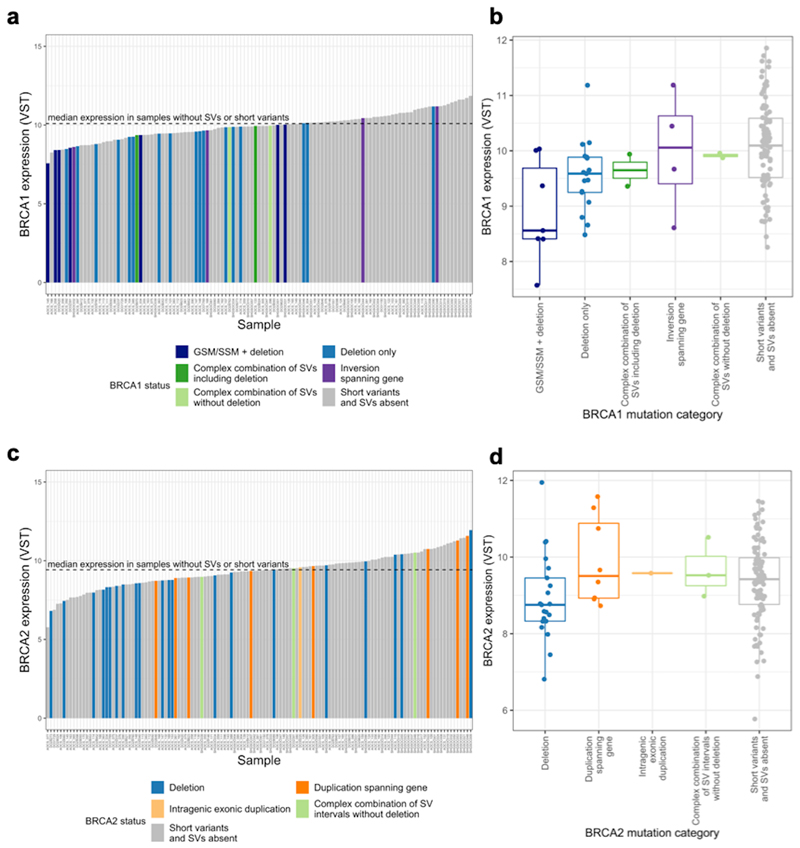
Figure 2. Structural variation and expression of BRCA1/2 in the combined HGSOC cohort.
a)c) Expression of BRCA1/2 (variance stabilising transformed RNA-seq counts) across samples ordered from lowest to highest expression. Median BRCA1/2 expression is indicated by a black dashed line. Sample bars are coloured by BRCA1/2 mutational category. b)d) Boxplot of BRCA1/2 expression for each category of BRCA1/2 mutation. The BRCA1 deletion category is split into those samples with SNVs and deletions and those with only deletions as their expression is significantly different (Supplementary Figure 5a). This is not the case for BRCA2 so all samples with deletions are considered together to maximise the available sample size (Supplementary Figure 5b).

