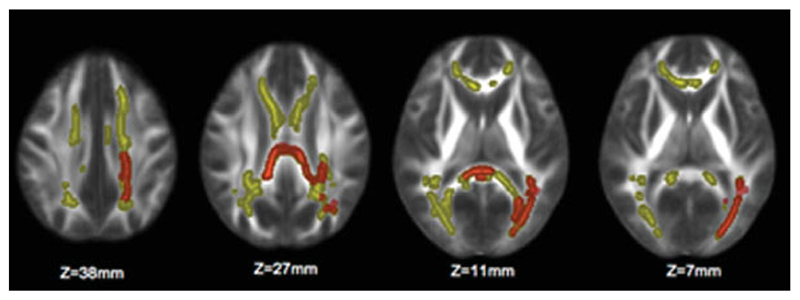
Figure 2.
Yellow clusters represent brain areas with a significant inverse correlation between T2-lesion volume (T2-LV) and FA (ie, where higher T2-LV is correlated with a significant decrease in FA). Regions overlapping with the significant inverse correlation between FA and the number of previous relapses are marked in orange. The significant regions have been thickened for better visibility. The background image is the group mean FA. Images are shown in radiological convention. [Color figure can be viewed in the online issue, which is available at www.interscience.wiley.com].

