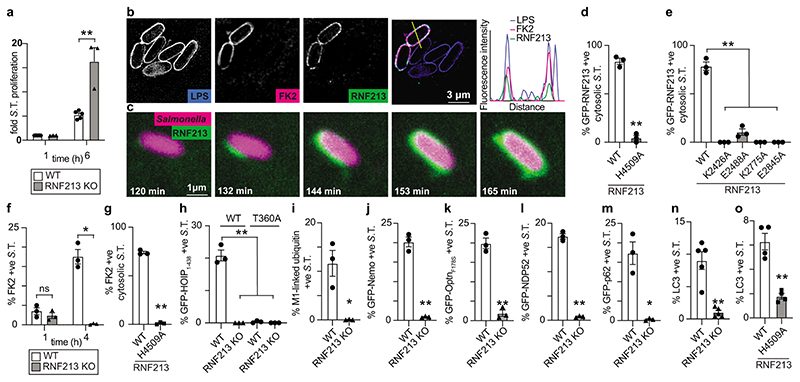
Figure 4. RNF213 provides cell-autonomous immunity.
a, Fold replication of intracellular S. Typhimurium in WT and RNF213KO MEFs normalised to 1 h p.i. time point. Bacteria were counted by serial dilution of cell lysate on LB agar plates. b, Structured illumination micrograph of HeLa cells at 4 h p.i. with S. Typhimurium and immunostained for LPS, ubiquitin (FK2) and RNF213. Scale bar, 3 pm. Line indicates the plot profile adjacent. c, Still images from Video 1: Instant structured illumination microscopy (iSIM) of MEFs expressing FLAG-GFP-RNF213 infected with mCherry-expressing S. Typhimurium. Time p.i. as indicated. Scale bar, 1 pm d-e, Percentage of cytosolic S. Typhimurium positive for FLAG-GFP-RNF213 at 3 h p.i. in WT or RNF213KO MEFs stably expressing the indicated GFP-RNF213 alleles. f-o, Percentage of S. Typhimurium positive at 3h p.i. for FK2 (ubiquitin) (f,g), GFP- HOIP1-438 WT or T360A (h), M1-linked linear ubiquitin chains (i), GFP-Nemo (j), GFP-OptineurinF178S (k), GFP-NDP52 (l), GFP-p62 (m) and LC3 (n,o) in WT and RNF213KO MEFs (f,h-n) or RNF213KO MEFs stably expressing the indicated GFP-RNF213 alleles (g,o). Statistical significance was assessed by two-tailed unpaired Student’s t-test (a,d,f,h,i-o) or one-way anova (e,h). *P < 0.05, **P < 0.01. Data are expressed as the mean ± s.e.m. of 3 (a- m),4 (o) or 5 (n) independent biological repeats (see source data Fig. 4).

