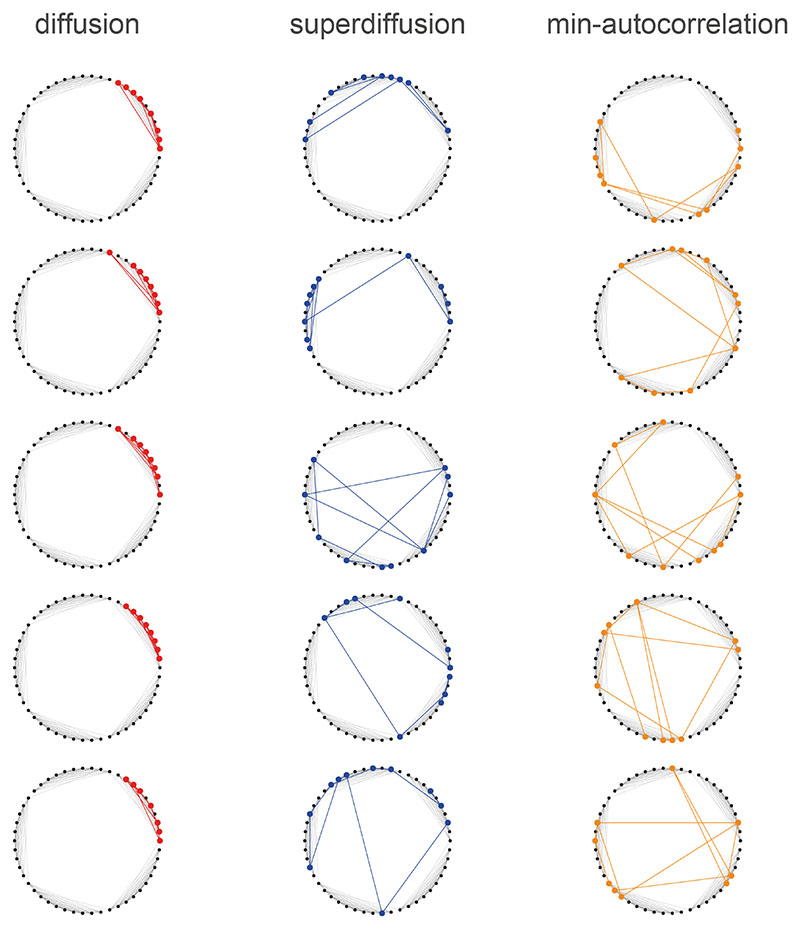
Figure E7. Sampled sequences exhibit distinctive patterns across spectral modulation regimes.
Each column shows five sample sequences generated in one of the three sampling regimes studied in Fig. 7. Note that diffusions (left column) tend to remain within a single clique. Superdiffusions (middle column) interleave local diffusions with occasional jumps to other cliques. Jumps are observed as lines crossing the center of the ring which do not conform to any transition step in the underlying state-space structure (grey lines). Minimally autocorrelating propagators (right column) repeatedly generate large jumps between cliques.

