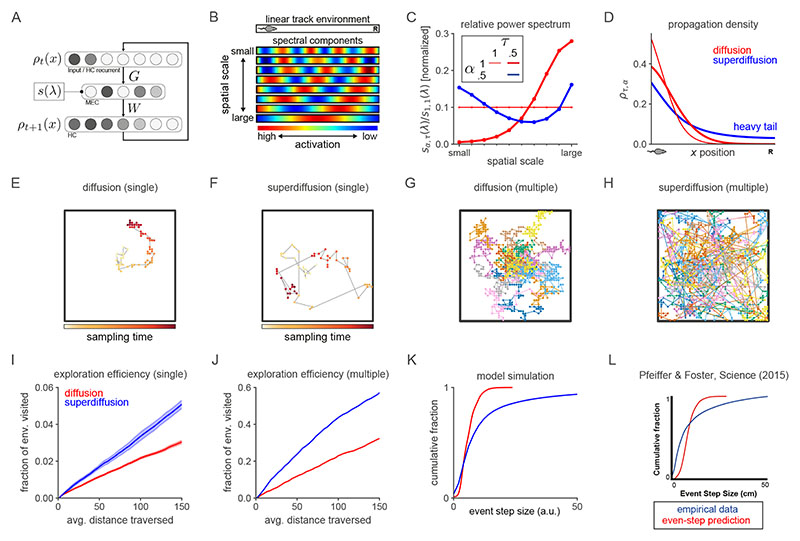
Figure 2. Spectral modulation of grid cell activity alters the statistical structure of hippocampal sequence generation.
A. Abstract entorhinal-hippocampal circuit model. ρt and ρ t+1 are the propagation distributions over environment position at time-steps t and t + 1 respectively. The weight matrices G and W are identified with the generator decomposition O = GΛW. s(λ) is the power spectrum expressed as a function of the generator eigenvalue λ associated with each unit (i.e., spectral component) in the MEC layer. B. Firing maps of units in the MEC layer which exhibit periodic tuning across a range of spatial scales reminiscent of grid cells. Spectral components are equivalently ordered by their eigenvector numbers k and generator eigenvalue magnitudes |λk| from large to small scale. C. Characteristic changes in the power spectrum associated with the diffusive and superdiffusive regimes are highlighted by the corresponding power ratios relative to a baseline. τ-modulated diffusion (α = 1, τ = 0.5, thick red line) results from a downweighting (upweighting) of small-scale (large-scale) spectral components while a-modulated superdiffusion (α = 0.5, τ =1, thick blue line) upweights both small- and large-scale components but suppresses at medium scales. D. Diffusive (α = 1, red lines) versus superdiffusive (α = 0.5, blue line) propagation densities ρτ,α = 1 x0 GSτ,αW in a linear track environment where x 0 corresponds to the location of the rodent. By modulating the tempo τ = 0.5, diffusive propagation can sample over larger distances (thick red line) compared to the baseline diffusion (τ = 1). However, only superdiffusive propagation facilitates an extraordinary jump to the reward (R). Note that these continuous propagation densities have been interpolated from the discrete propagation vectors output by our model. Further technical details are presented in Fig. E5. E-F. Single diffusive (panel E) and superdiffusive (panel F) sequences in an open box environment. The color code from yellow to red reflects the sampling iteration (from the initial sample to the final). Sequences are initialized at the centre of the environment. G-H. Multiple diffusive (panel G) and superdiffusive (panel H) sequences each distinguished by color. I. Mean and standard error of exploration efficiency for individual trajectory simulations (n = 20). J. Parallelized exploration efficiency across all the trajectories in panels G, H. K. Cumulative histogram of step sizes for diffusive trajectories (red) and superdiffusive trajectories (blue). An event refers to the successive representation of two different locations. Step size is measured by Euclidean distance. Therefore the x-axis reflects the Euclidean distance between successively sampled locations during sequence generation. L. Statistical analyses of hippocampal recordings in Ref. [36] indicated that hippocampal trajectory events were superdiffusive since the distribution of step sizes between state activations (blue) was heavy-tailed. This qualitatively matched the simulated cumulative histogram for superdiffusions in panel K in contrast to the prediction (red) based on simulated sequences composed of states separated by equal step sizes. In our model, the latter corresponds to diffusive sequence generation with τ varied to match the velocities exhibited by the recorded trajectory events.

