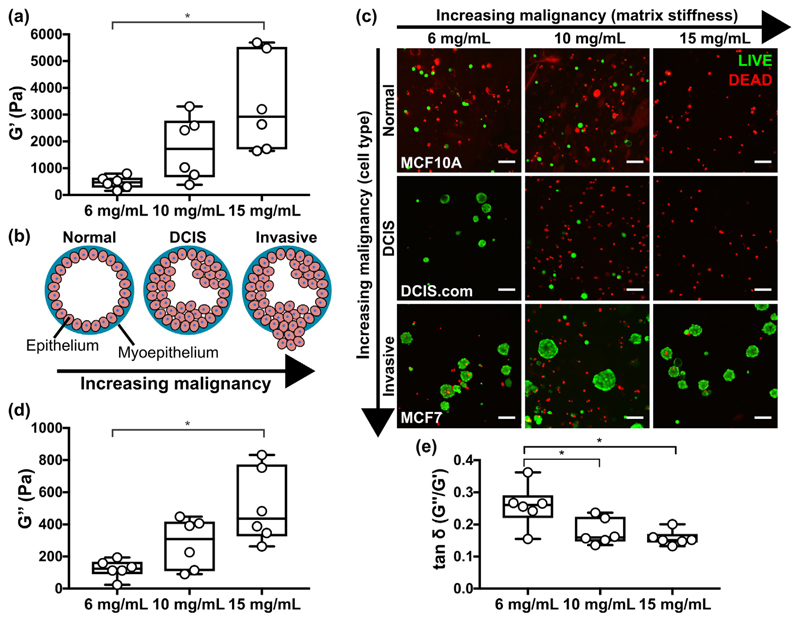
Fig. 7.
Increasing peptide gel concentration produces corresponding increase in stiffness. (a) Box plots (n = 6) showing G' results of increasing peptide gel concentrations characterised using bulk oscillatory rheology, (b) schematic of the increase in malignancy in breast cancer associated with increasing matrix stiffness, (c) LIVE/DEAD staining of breast epithelial cell lines MCF10A, DCIS.com and MCF7 in peptide gels of increasing stiffness. Box plots (n = 6) showing (d) G“ and (e) tan δ measurements correspond to the G' values shown in (a). Scale bar 100 μm. *indicates p < 0.05 (one-way ANOVA with Tukey post-hoc).

