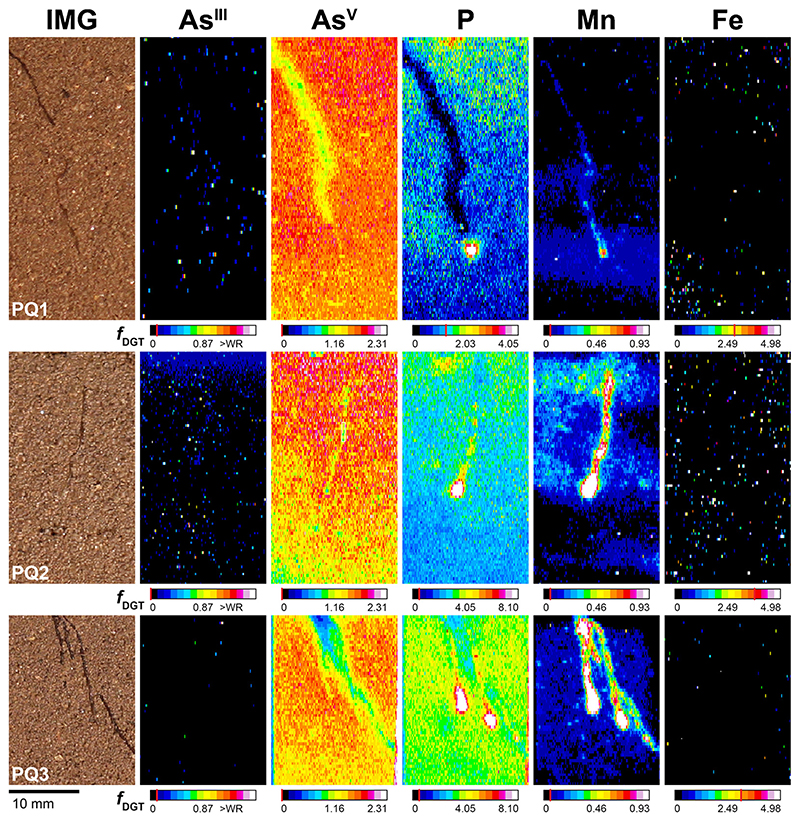
Fig. 4.
Solute images of labile AsIII, AsV, P, Mn and Fe in the rhizosphere of PQ after 24 h of dual-layer DGT application, 70 (PQ1, PQ2) and 72 (PQ3) DAP in rhizotrons filled with Forst99 soil. Solutes are shown as metal(loid) fluxes, fDGT, in pg cm-2 s-1. Note that AsIII images are slightly rotated and offset compared to As, P, Mn and Fe images, as the MSG was not perfectly overlying the MBG during dual-layer DGT sampling. Analyte MDLs are indicated by the red line in the corresponding calibration bars. WR denotes the upper limit of the calibration working range. (For interpretation of the references to colour in this figure legend, the reader is referred to the web version of this article).

