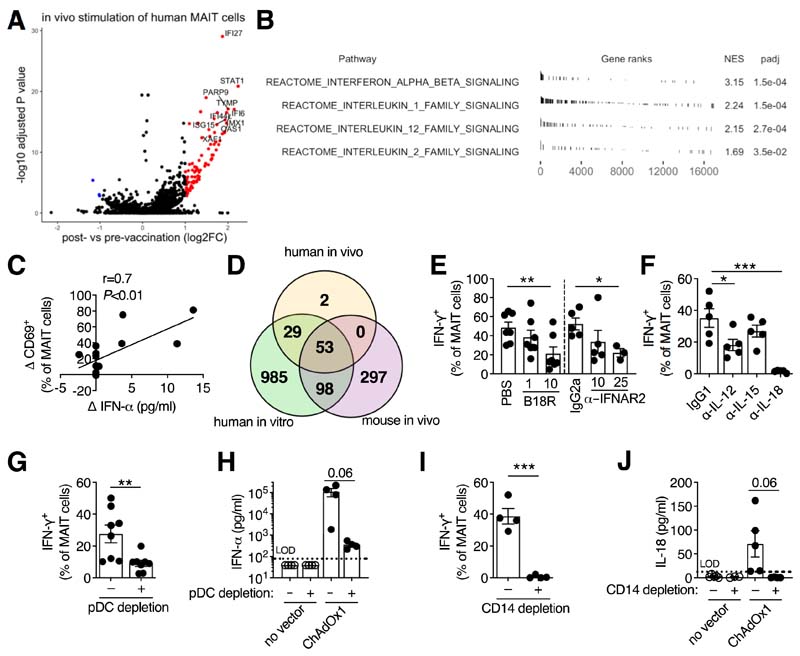
Figure 2. Activation of MAIT cells by adenovirus vectors requires pDC-derived IFN-α and monocyte-derived IL-18.
(A and B) Gene expression analysis of MAIT cells isolated from the PBMCs of human volunteers 1 day pre- and 1 day post-vaccination with ChAdOx1 MenB.1 (n=14). (A) Volcano plot of differentially expressed genes (log2 FC>1, adjusted P<0.05). The top 10 upregulated genes are annotated. (B) Selected cytokine signaling pathways from the Reactome database enriched by Gene Set Enrichment Analysis. (C) Pearson correlation of change in plasma IFN-α level following vaccination with the change in MAIT cell CD69 expression. (D) Overlap of genes upregulated in MAIT cells from ChAdOx1-vaccinated volunteers, from human PBMCs stimulated with ChAdOx1, and from the draining inguinal LNs of ChAdOx1-vaccinated mice. (E and F) Human PBMCs were stimulated with ChAdOx1-GFP and the following inhibitors were used: vaccinia virus-derived type I interferon antagonist B18R (1 or 10 μg/ml; n=7; three experiments) or anti-IFNAR2 antibody (10 or 25 μg/ml; n=5 or 3; two or one experiments, respectively) (E) or anti-IL-12, anti-IL-15, or anti-IL-18 antibodies (10 μg/ml; n=5; two experiments) (F). MAIT cell IFN-γ expression was measured after 24 hours. (G and H) PBMCs were depleted of CD123+ pDCs or left untreated and stimulated with ChAOx1-GFP. MAIT cell IFN-γ expression (n=8; three experiments) (G) or levels of IFN-α in the cell culture supernatant (n=4; one experiment) (H) were measured after 24 hours. (I and J) PBMCs were depleted of CD14+ monocytes or left untreated and stimulated with ChAdOx1-GFP. MAIT cell IFN-γ expression (n=4; two experiments) (I) or IL-18 levels in the supernatant (n=4; three experiments) (J) were measured after 24 hours. *, P<0.05; **, P<0.01; ***, P<0.001. Repeated-measures one-way ANOVA with Dunnett Correction (E and F), or unpaired t test (G to J). Symbols indicate individual donors. Mean ± SEM are shown.

