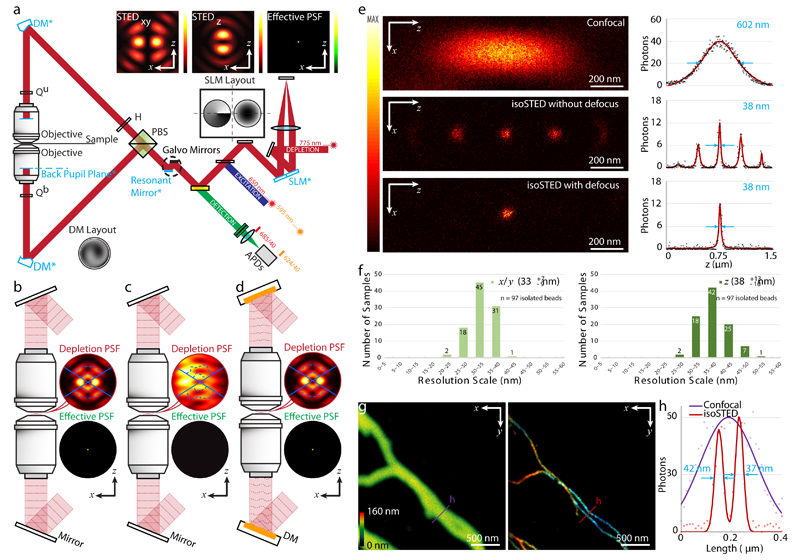
Fig. 1. Principle and performance of adaptive optics (AO) isoSTED nanoscopy.
(a) Simplified schematic. Abbreviations: PBS, polarizing beam splitter; H, half-wave plate; Qu, upper quarter-wave plate; Qb, bottom quarter-wave plate; DM, deformable mirror; SLM, spatial light modulator. The conjugated planes are indicated with an asterisk and highlighted in blue. Inserts on top: simulated intensity distributions in the focal region. (b) – (d) Principle of aberration correction in isoSTED nanoscope. Depletion and effective PSFs with and without sample-induced aberrations are shown as (b) and (c), respectively. (d) The deformable mirrors in the interference cavity introduce phase patterns that counteract aberrations, restoring nearly perfect optical performance. (e) xz|y=0 cross sections of the effective PSFs as measured with a 20-nm diameter crimson fluorescent bead. From top to bottom: single-objective confocal PSF, isoSTED PSFs with (bottom) and without (middle) defocus added to the STEDz pattern. To the right of each PSF, the respective axial intensity profiles (z) are displayed. The raw data (black dots) are fitted with a Lorentzian function (red curves), and the corresponding FWHMs are highlighted in blue. (f) Histogram of the lateral (left) and axial (right) FWHMs in isoSTED mode. At the top-right corner of each histogram, the average FWHM and the corresponding value range are given (data from 97 isolated 20-nm-diameter crimson fluorescent beads, see Extended Data Fig. 2). (g) Confocal and isoSTED images of microtubules in the same region of a COS-7 cell. The distribution of α-tubulin (labeled with ATTO 647N) is visualized. The axial position of the microtubules is indicated using a rainbow colormap. A total of 16 optical sections (256×256 pixels each) were imaged. To maintain comparable brightness and contrast, the pixel dwell time in the confocal image (left) is 6 times shorter than that in isoSTED image (right). (h) Intensity profiles at the positions denoted by the solid lines in (g). The raw data (dots) are fitted with Lorentzian functions (solid curve). The corresponding FWHMs of the red line profiles from the isoSTED image are highlighted in blue.

