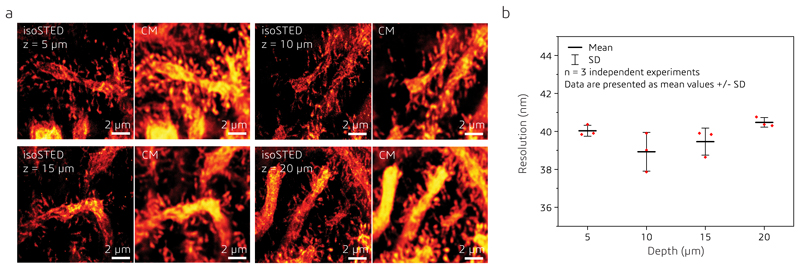
Extended Data Fig. 10. isoSTED and confocal images of calbindin in mouse cerebellar sections at different depths (z).
(a) xy cross sections of isoSTED and confocal microscopy (CM) images at different depths. (b) Resolution at different depths (n = 3 independent experiments). Data points and error bars represent the mean values of three different data sets and the respective standard deviation. An equivalent analysis of the CM images yields an average resolution of 307 nm.

