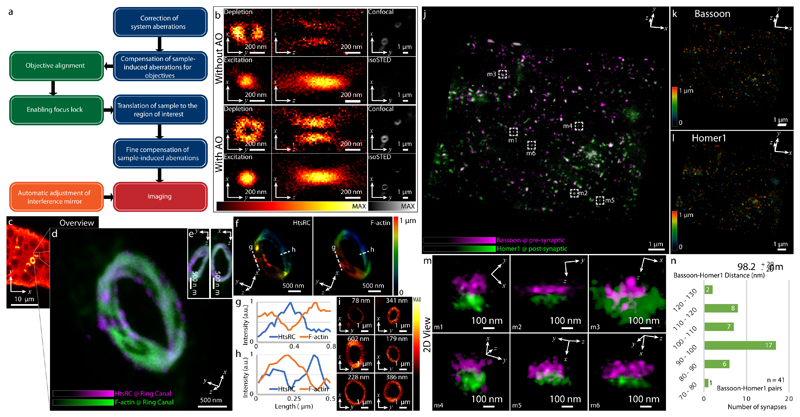
Fig. 3. IsoSTED images of Drosophila egg chambers and mouse hippocampal brain tissue.
(a) Control loop of the AO strategy used for imaging tissue samples via isoSTED nanoscopy. (b) Effects of AO on the imaging performance of isoSTED. The figures in the left and middle columns show the xy|z = 0 (left) and xz|y = 0 (middle) cross-sections of the PSFs with (bottom two rows) and without (top two rows) AO aberration correction. The PSFs were obtained by imaging 150-nm-diameter gold beads. The right column shows 2D images of ring canals in a Drosophila egg chamber recorded in confocal and isoSTED modes. The F-actin proteins on the ring canals are immunolabeled with ATTO 594. (c) Overview image of Drosophila egg chambers. (d) Magnified image of a single ring canal recorded in isoSTED mode showing F-actin (green) and HtsRC (magenta) immunolabeled by ATTO 594 and ATTO 647N, respectively. (e) Front (left) and side (right) views of the ring canal shown in (d). (f) Axial positions of HtsRC (left) and F-actin (right) indicated using a rainbow colormap. (g) - (h) Intensity line profiles at the positions denoted by the dashed lines in (f). (i) F-actin staining of six ring canals in the same egg chamber. At the top-right corner of each sub-figure, the ring thickness is given (measured as the FWHM of the intensity profile in radial direction in the corresponding 2D ring). (j) IsoSTED image of hippocampal excitatory synapses visualized by immunolabeling the presynaptic active zone marker Bassoon and the postsynaptic scaffolding molecule Homer1 with ATTO 594 and ATTO 647N, respectively. (k) - (l), Axial positions of Bassoon (k) and Homer1 (l) in (j) indicated using a rainbow colormap. (m) Magnified projection images of the pre- and postsynaptic labels at the positions highlighted in (j). The trans-synaptic axes in these figures are rotated into the viewing planes. (n) Histogram of the Bassoon-Homer1 distances (measured as the peak-to-peak distance between the intensity distributions of the two stainings). At the top-right corner of the histogram, the average distance and the value range are given (data from 41 Bassoon-Homer1 pairs).

