Figure 4.

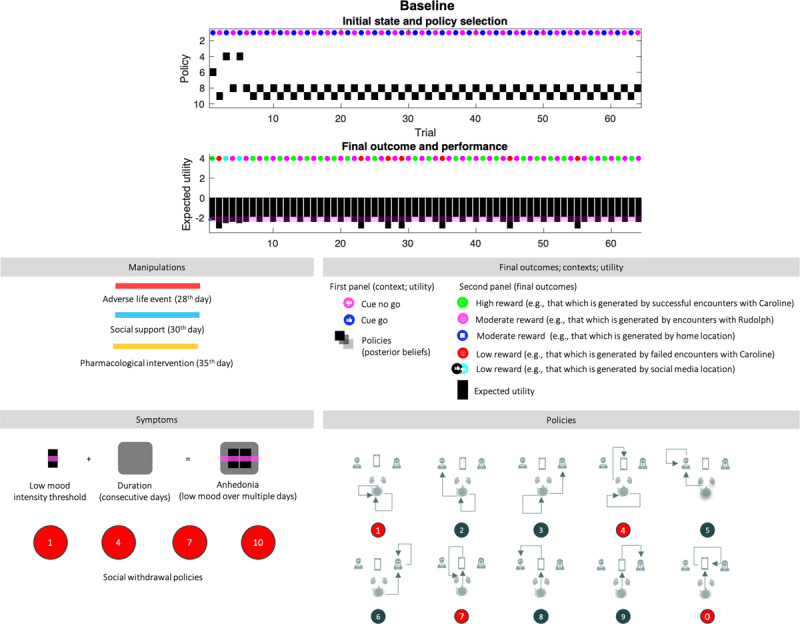
Baseline. Top panel: The upper images show the posterior expectation of each of 10 policies (see method, Figure 2) as they evolve from day to day (64 in total). The small circles in the upper part of these panels indicate the observed outcomes (context in the first panel, and outcome in the second). The context changes every other day. The pragmatic value of these outcomes is shown as a (black) bar chart in the second panel. The lower panel describes the interventions that depend on the condition, and the symptoms, which are: (i) anhedonia when pragmatic value or reward (black bars) are below the pink bar over multiple days (duration, black shaded rounded rectangles), and (ii) social withdrawal, expressed by policies 1,4,7, and 10. The lower left panel provides a legend (upper) and a graphical description of the policies (lower). The intensity component of anhedonia corresponds inversely to the expected utility of a policy, or the extent to which it will yield preferred outcomes. Narratively speaking, this amounts to expecting socially rewarding outcomes when engaging a certain action. The intensity component of anhedonia is thus defined as low appetitive action. We assume that normal levels of appetitive action correspond to the expected utility experienced on most days, for a healthy (baseline) agent (pink line). The duration component of anhedonia corresponds to the number of consecutive days. A normative assessment of anhedonia thus would involve 14 consecutive days, as is the case in the condition of severe depression below.
