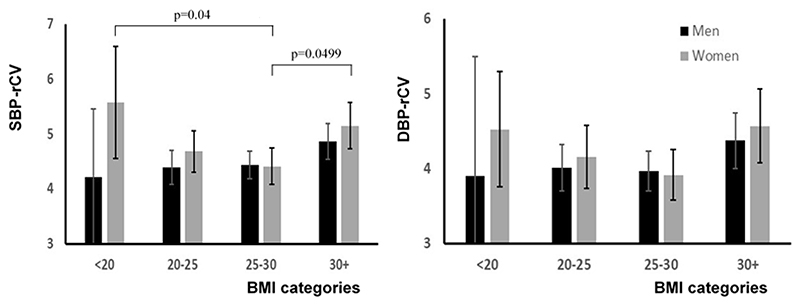
Figure 2. Mean values of rCV for systolic (SBP) and diastolic (DBP), stratified by sex and standard thresholds for BMI.
Results are presented as the mean and confidence interval for each group. rCV is calculated as the coefficient of variation of de-trended recordings. There is a significant difference between groups for SBP-rCV for women only (ANOVA p=0.014), with significant post-hoc tests adjusted for multiple comparisons shown (Tukey test).

