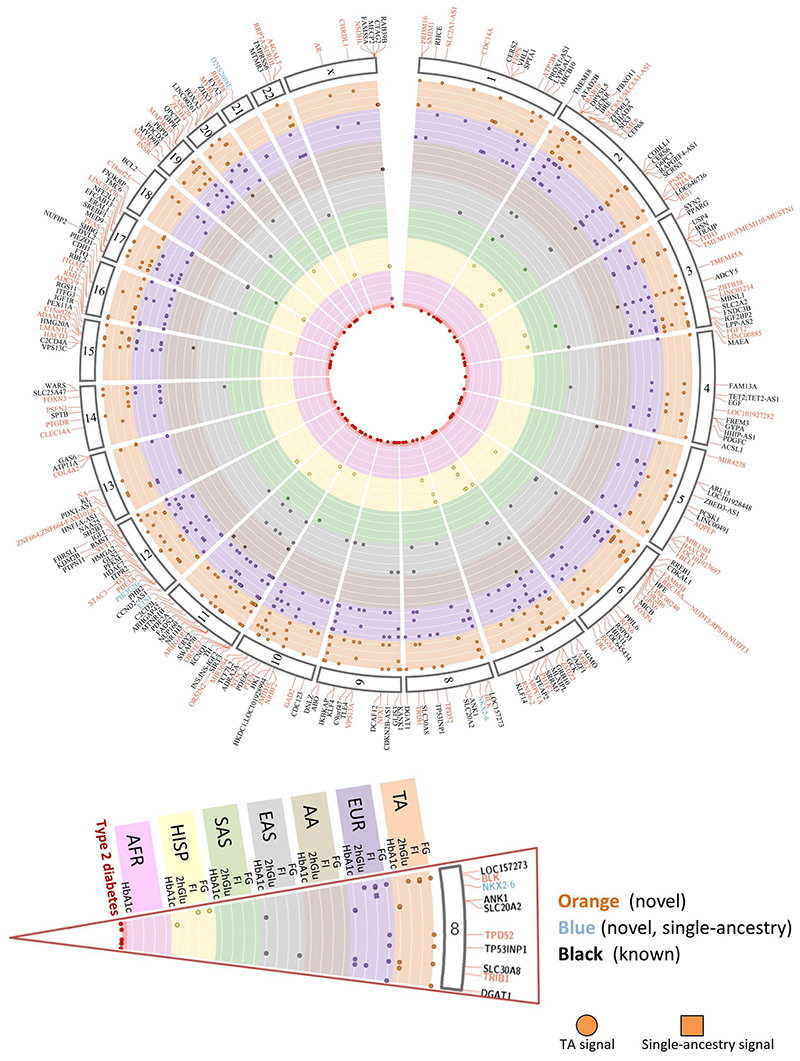
Figure 1. Summary of all 242 loci identified in this study.
235 trans-ancestry loci are shown in orange (novel) or black (established) along with seven single-ancestry loci (blue) represented by nearest gene. Each locus is mapped to corresponding chromosome (outer segment). Each set of rows shows the results from the trans-ancestry analysis (orange) and each of the ancestries: European (purple), African American (tan), East Asian (grey), South Asian (green), Hispanic (yellow), sub-Saharan African (Ugandan-pink). Loci with a corresponding type 2 diabetes signal are represented by red circles in the middle of the plot.

